At 8:47 on a Monday morning in September, Mia Chen stood in the lobby of a glass office building in Harbor and ordered a tea on her phone.
Harbor is the largest of the four cities where Steep works. Steep is a tea-delivery app: you order on your phone, a nearby Steep store makes the drink, and a courier brings it to you, or you collect it at the counter.
Oolong milk tea, less sugar, no ice. She paid with one tap. The app showed a small green tick and a code: A1024. Two minutes later a paper receipt slid out of the printer at the counter of the Steep store on the ground floor, with the same code printed at the top.
The code is a pickup code. The letter stands for the store, and the number counts that store’s orders for the day. So tomorrow, another customer will get A1024 too. The code alone is not unique. Together with the store and the time on the receipt, it points to one order: hers.
Mia folded the receipt and put it in her notebook. She had kept receipts for eleven years, as an internal auditor. Auditors do that. Today was the first day of her new job: Steep’s first data analyst.
The question
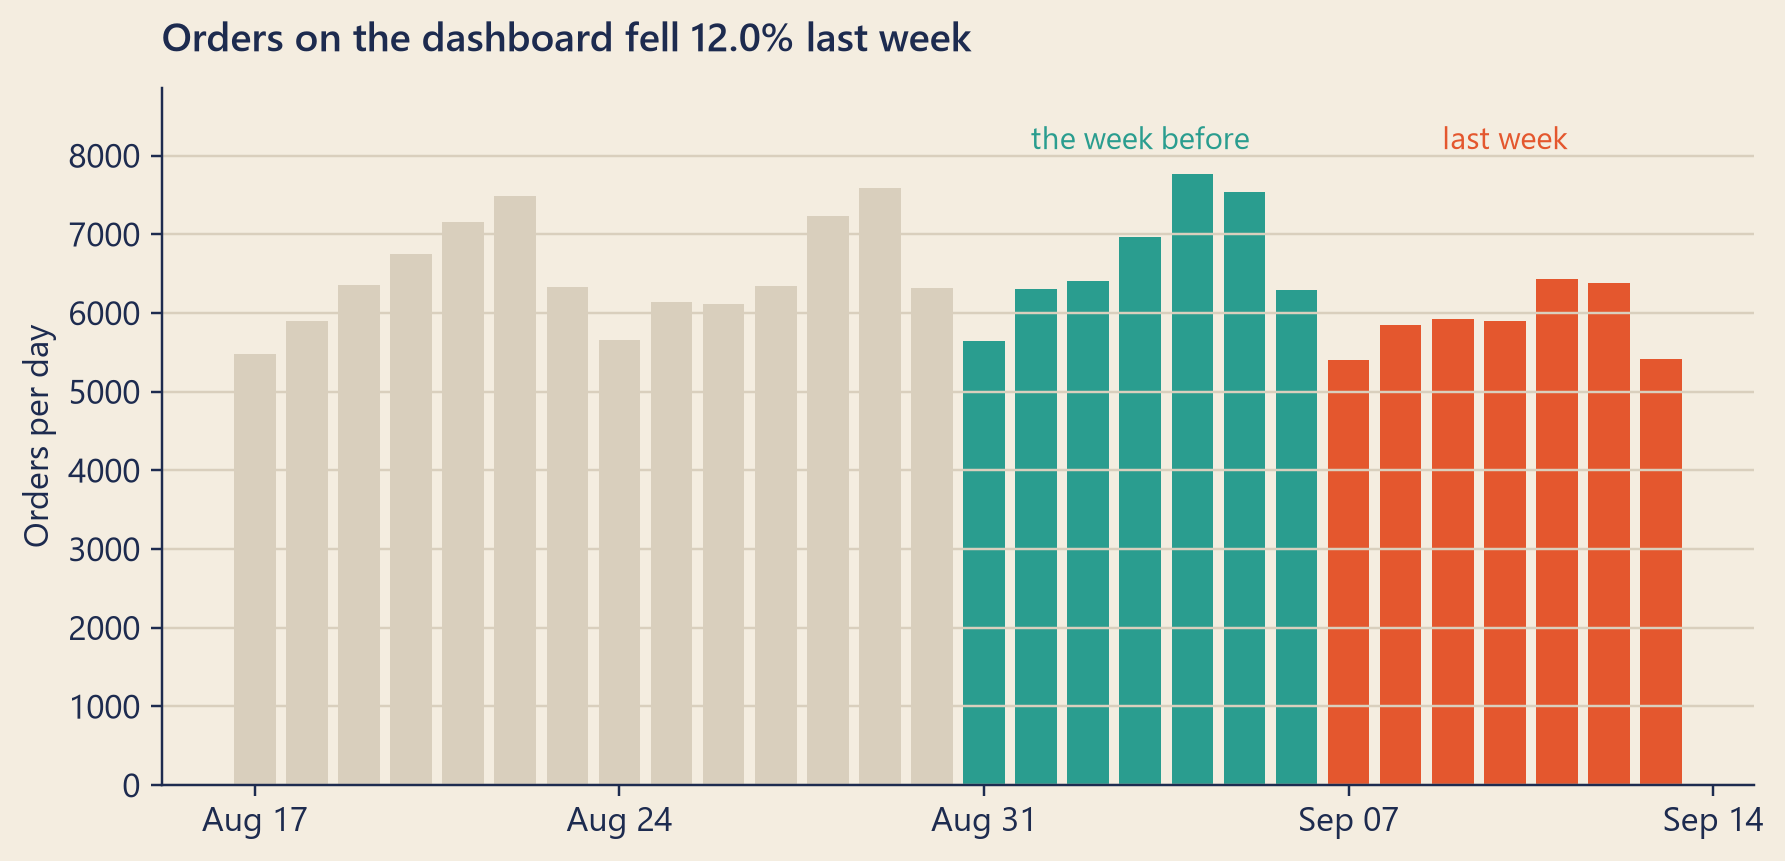
At 9:30 she sat in the office of Dana Reyes, the CEO and co-founder of Steep. A large screen on the wall showed the company dashboard. One line on it was falling.
“Welcome,” said Dana. “I’m sorry, there is no gentle first week. Look at that.”
She pointed at the screen.
Show the code
import matplotlib.dates as mdates# What Dana could see on Monday 14 September: the four weeks up to yesterday.recent = dash[dash.day.between(w1_start - pd.Timedelta(days=14), w2_end)].copy()in_w1 = recent.day.between(w1_start, w1_end)in_w2 = recent.day.between(w2_start, w2_end)colors = [bk.TEAL if a else bk.TOMATO if b else bk.GRID for a, b inzip(in_w1, in_w2)]fig, ax = bk.figure(8, 3.8)ax.bar(recent.day, recent.orders, color=colors, width=0.8)ax.set_title(f"Orders on the dashboard fell {bk.fmt_pct(-reported)} last week")ax.set_ylabel("Orders per day")top = recent.orders.max()for start, label, color in [(w1_start, "the week before", bk.TEAL), (w2_start, "last week", bk.TOMATO)]: ax.text(start + pd.Timedelta(days=3), top *1.04, label, color=color, ha="center", fontsize=10)ax.set_ylim(0, top *1.14)ax.xaxis.set_major_locator(mdates.WeekdayLocator(byweekday=mdates.MO))ax.xaxis.set_major_formatter(mdates.DateFormatter("%b %d"))
Figure 1: The chart on Dana’s wall. Each bar is one day of orders, as the dashboard counts them.
“Last week we had 41,289 orders,” Dana said. “The week before, 46,924. That is a drop of 12.0%, week over week. We have never dropped like that. Priya, our product manager, thinks it is the weather. Marketing thinks a competitor opened in Northgate. Theo, our data engineer, thinks the dashboard is lying. Theo always thinks the dashboard is lying.”
She turned away from the screen.
“The board meets at the end of October. I don’t want a guess. I want to know where the twelve percent went.”
Mia opened her notebook. “Can I ask a strange question first?”
“Please.”
“Twelve percent of what?”
Dana blinked. “Of orders.”
“Which orders? Paid ones? Delivered ones? Cancelled ones? Counted by whom, from where, and when does a week start?”
Dana looked at her for a long moment. Then she laughed. “You really are an auditor. Good. That is why I hired one.”
Three questions before any answer
When a number moves, most people ask one question: what caused it? Mia asked three, in a fixed order. You will use the same three questions in every chapter of this book.
Is the number measured correctly? Maybe nothing changed in the world, and only the counting changed. A broken sensor, a bug in an app, a report that counts something new.
Is the comparison fair? Maybe the number is right, but the baseline, the week you compare it with, was unusual. A holiday, a storm, a sale.
What really changed? Only after the first two questions are answered do you look for a real cause, such as a new price, a new competitor, or a new feature.
ImportantThe big idea
Before you explain a change, check that it is measured correctly, then check that the comparison is fair. Only then ask what caused it.
The order matters. If you start with question three, you will always find a cause. There is always a competitor, a price change, or a rainy day nearby. A story that fits is not the same as a story that is true.
The twelve percent on Dana’s wall might be one of these three things. It might be a mix of all three. Finding out how much belongs to each is the case that runs through this book.
What Mia has to work with
Theo sent Mia a message before lunch. It said: “Welcome. Everything is in the warehouse. Trust nothing. Coffee is on floor 3. There is tea everywhere. It is a tea company.”
The warehouse Theo meant is not a building. A data warehouse is one central database where a company collects its data and cleans it for analysis. “Everything” meant several kinds of data. You will meet each of them properly later. For now, here is the map.
Kind of data
What it records
Where you will meet it
Orders
Every order in Steep’s main database: who, what, where, how much, and its status
Part I
App events
Every tap in the app: opening it, viewing the menu, adding to cart, paying
From Chapter 1; how they travel in Chapters 7–8
The data platform
The same data, copied and cleaned in steps; each step is saved as its own tables
Part II
Experiments
Which users saw which version of the app during A/B tests (some users see version A, others see version B, and you compare them)
Part IV
Weather
Rain, every day, in every city
Chapter 16
Orders and app taps are copied into the data platform, and Dana’s dashboard is built from the platform. So the dashboard sits at the very end of a chain. It is the last stop of a long journey. Whatever went wrong could have gone wrong at any stop on the way.
TipAudit Instinct · Tracing and vouching
Auditors test records in two directions.
Vouching starts from a number in the books and walks backwards to the evidence. It answers: is this entry real?
Tracing starts from the evidence, such as a receipt, and walks forwards into the books. It answers: did everything that happened get recorded? This is a test of completeness.
A dashboard can be wrong in both ways. It can show things that did not happen, and it can miss things that did. Mia’s first instinct was to trace. She had a receipt in her notebook: order A1024. She would follow it forwards, all the way to Dana’s screen. In Part II, you follow it with her.
How this book is organised
The book follows Mia’s investigation, and it follows the three questions.
Part I, Look Before You Leap (an English saying: check before you act), teaches you to read numbers: what a metric really is, why averages mislead, how to ask questions in SQL (a language for asking a database questions), and how charts can lie.
Part II, The Journey of One Order, follows order A1024 from Mia’s phone to Dana’s screen. On the way you will meet the machinery of modern data teams: Kafka, data lakes, Hive, Spark, warehouses, pipelines, and streaming. This is where measured correctly? gets answered.
Part III, Living With Uncertainty, teaches you how to think about randomness, and how to tell a real change from noise (random ups and downs that mean nothing). This is where is the comparison fair? gets answered.
Part IV, The Art of the Experiment, teaches A/B testing, from your first test to the traps that catch experts. This is where what really changed? gets answered.
Part V turns all of it into a decision, and the Epilogue closes the case.
Reported change: −12.0% orders, last week compared with the week before (CEO dashboard).
Explained so far: 0 of the 12 percentage points. (A percentage point is one step on the percent scale. The drop is about 12 points; each cause we find will explain some of them.)
Open questions: Is it measured correctly? Is the comparison fair? What really changed?
Evidence in hand: one receipt, pickup code A1024, Monday 08:47.
Recap
A number on a dashboard is the last stop of a long journey. Errors can enter at any stop.
Ask three questions in order: measured correctly? fair comparison? what really changed?
A story that fits the data is not yet a story that is true.