Epilogue · Friday

The meeting
At 2 pm on Friday 30 October, the board of directors of Steep met in the long room on the top floor. Seven chairs stood around the table, with a cup of tea and one sheet of paper at each place. The sheet was the memo. Mia sat on a chair by the wall with her notebook. Dana had asked her to come and answer questions, not to give a talk.
Dana did not show any slides. She read the headline aloud.
“Orders fell 5%, not 12%, and most of that was a rainy comparison week. The only lasting loss, about 2% of orders, came from our price rise. We recommend keeping the price while a longer test measures its effect on profit.” She looked up. “The rest of the page says how sure we are and what I am asking you to decide today. It takes three minutes. Please read it.”
The room was quiet for three minutes, which felt longer.
Ruth Ali, who chairs the board, spoke first. “So orders did not really fall twelve percent?”
“No,” said Dana. “App events fell twelve percent. Orders fell five. The dashboard counts events: small messages that the app sends, one of them when someone pays. For 7.0 points of the twelve, that event never arrived. The tea was made, paid for and drunk; the app forgot to say so. And most of the five was the weather: the week before had been unusually rainy, and rain sells tea.”
A board member at the far end tapped the table. “A fix is only a promise. How do you know the bug is fixed?”
Dana turned to Mia.
“We count it,” said Mia. “On iPhones, the share of orders with no event peaked at 37.0% on 23 September. The fix came out the next day. Since 7 October, about 0.4% of iOS orders lack an event: mostly the normal background loss, plus a few phones not yet updated, and none of those since 18 October. In the week of 12 October, 0.33% of all orders had no event, the normal level.”
“And if it breaks again?”
“A nightly test checks every app version and payment method. It fails that night if the broken group has 50 or more orders a day. A second check fails if more than 1% of all orders lack an event. Smaller groups can slip past both checks: on 4 October, 49 broken orders passed both, because all orders together lacked only 0.97%. That is why Theo is adding a rule for them this week.”
The same board member leaned forward. “The app update and the price rise both came on 7 September. How do you tell them apart?”
“Order by order,” said Mia. “The bug left 3,361 orders in the database with no event. Those are real orders, made and paid for, so they are not a loss. The price we measured in August, before the app changed, with a coin.”
Ruth turned the page over, found nothing on the back, and turned it again. “How sure are you about the price?”
“Sure that it is real, because it was a randomised test,” said Mia. “Less sure of its exact size. In August, a coin chose half of the app users to see prices 5% higher. With the higher prices, orders per user were 2.1% lower. The 95% interval runs from 0.5% lower to 3.8% lower: a range the data fit, made by a method that catches the true effect 95 times in 100. Revenue per user did not move in a way we can see: anything from 2.4% lower to 1.1% higher. The bug, by comparison, is a count, and the range for the rain is much tighter.”
“So was the price rise a good idea?”
“At the test’s best estimates, yes,” said Dana, “unless a drink costs us less than about 88 cents. We sell fewer drinks for about the same money, so we spend less making them. Finance confirms our cost on Monday. That is if customers who now order less don’t leave later; the longer test is there to find out.”
The board member at the far end had one more question. “The test that was read on day three. Whose mistake was that?”
Mia watched Dana. Dana did not look at anyone.
“No one person’s,” said Dana. “We had no rule about when a test may be read, and no rule that a price change needs a finished test. I run this company, so those missing rules are mine. Most people here would have read it the same way. We have the first rule now; the rest is written by the end of November.”
He nodded and wrote something on his sheet.
At 2:40, Dana summed up. “Three decisions. One: we keep the price for now. Finance confirms the cost per drink on Monday, and Mia brings the plan for a longer test to the next board meeting. Two: in Riverside, we keep the fee, and we do not test dropping it. Winning back one order would cost about $22 in fees, more than an order brings in. Mia reports how often Riverside’s customers come back, every month. Three: the nightly check stays with its owner, and every test keeps its written plan. By the end of November, written test rules, and no price change without a finished test and finance’s sign-off.” She paused. “And one piece of good news. The new checkout raised the share of users who order by 1.6%. It is being released in steps. Five percent of users keep the old one for four weeks, as an alarm in case something goes badly wrong.”
“Agreed,” said Ruth, and looked around the table. Nobody disagreed.
The meeting ended early, which had never happened before. On the way out, Dana stopped at the screen on her office wall. It now showed two lines, each with its name: App events (order_completed) and Completed orders (database).
After
At 4:30, the kitchen on the third floor smelled of oolong. On Mia’s first day, Theo had written to her that coffee was on floor 3 and tea was everywhere. Both were true.
Theo poured three cups. Priya came in, took one, and stood by the window.
“Did anyone ask who read the price test early?” she said.
“Yes,” said Mia. “Dana said it was the process, and that the missing rules were hers.”
Priya looked into her cup. “The process was me.”
“The process was all of us,” said Theo. “For two years I said the dashboard was lying. I never wrote the test that would show it.”
Priya was quiet for a moment. Then she put her cup down. “For the loyalty test, I’ll write the plan first. Will you read it before it starts?”
“Before it starts,” said Mia.
Theo took a napkin from the box and drew a small, careful rectangle on it. “This is the dashboard,” he said. He drew a second rectangle next to it. “This is a dashboard with a test behind it.” He looked at the two drawings. “They look the same. That was always the problem.”
That evening, Mia opened her notebook at its last page. The receipt from her first morning was still folded inside the cover: A1024, Monday, 08:47. She wrote two lines.
7.0 + 3.4 − 0.3 + 1.9 = 12.0
7 + 3 + 2 = 12
Under them she drew a line, and closed the book.
Reported change: −12.0% orders, the week of 7 September compared with the week before (CEO dashboard).
Explained so far: 12.0 of the 12 points. Case closed. Measurement: the tracking bug, 7.0 (counted, Chapter 15). The comparison: the rainy week before, 3.4, and normal growth, −0.3 (estimated, Chapters 16–17). A real change: the price rise, 1.9 (confirmed by a randomised test, Chapter 21).
Suspects: none left.
Ruled out: a new competitor in Northgate (Chapter 5); customers leaving (Chapter 6); the matcha menu (Chapter 4); every stop on the data’s journey after the app (Chapters 8–14); the day-3 “win” for revenue per user (peeking, Chapter 21).
Open questions: none about the twelve percent. For Steep: finance’s cost per drink, and a longer price test that measures profit.
New evidence: the board’s three decisions, 30 October.
The machine behind the curtain
You knew from the first page that a program made Steep’s data. Here is what you did not know.
Mia is in the data. She is user u000001, who signed up at 08:31 on 14 September and ordered A1024 sixteen minutes later. The program’s starting number, its seed, is 20260914: her first day. And the program knows the true answers that Mia could only estimate. You will see them in a moment.
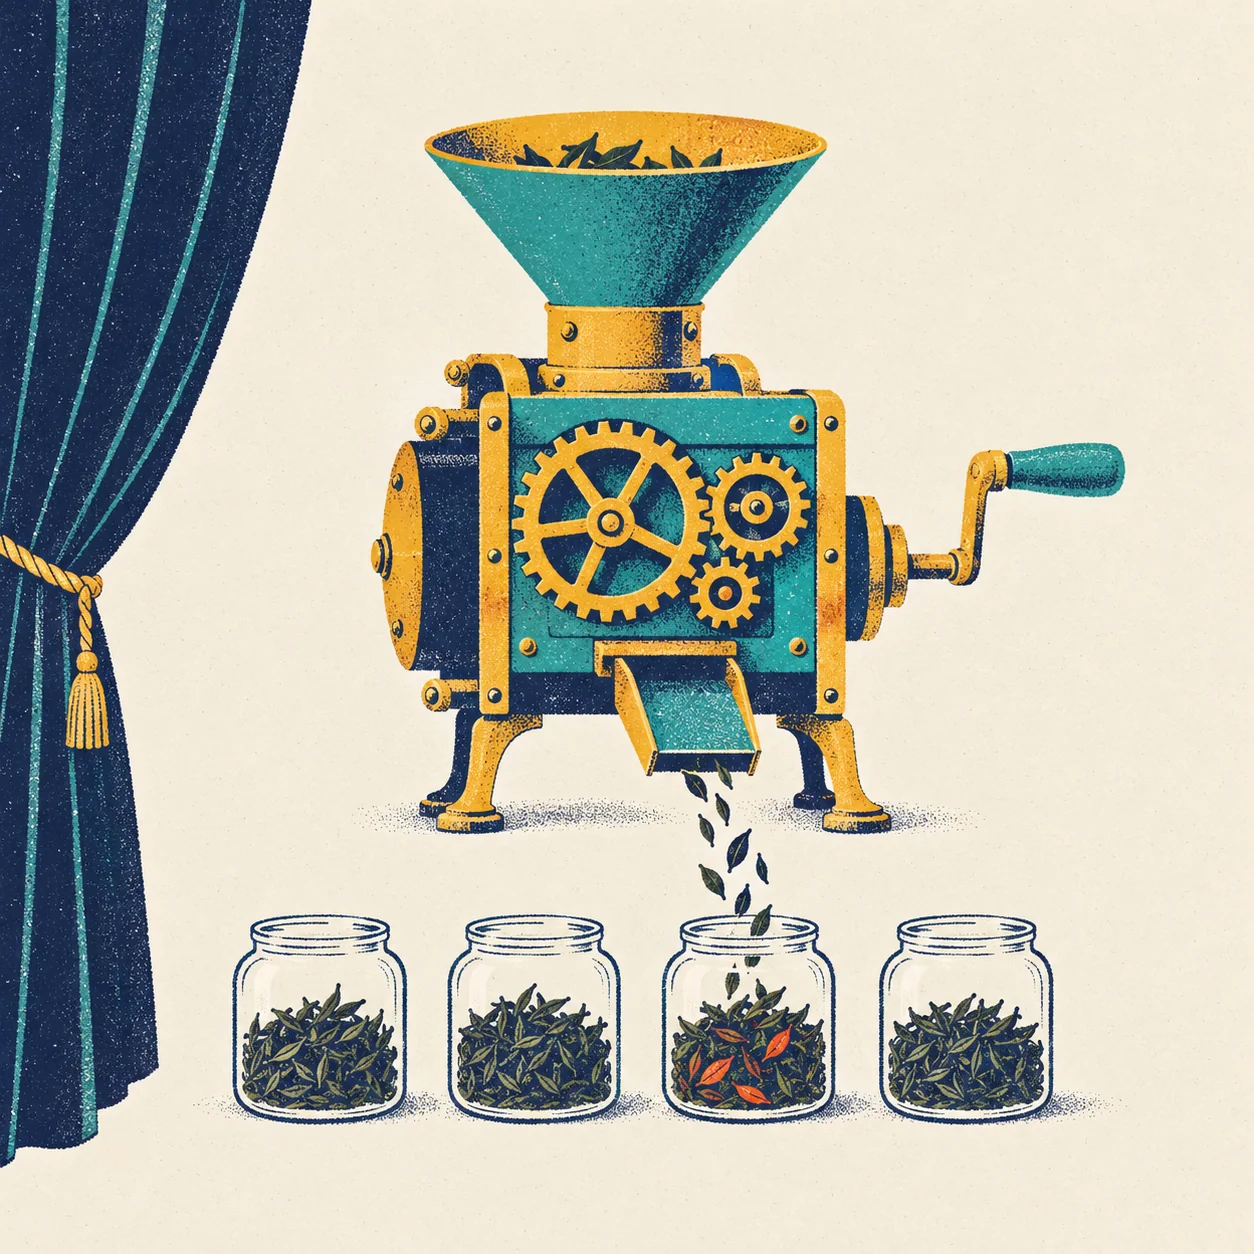
Data made by a program to behave like real data is called synthetic data. This program lives in data/generate.py and the steep/ package, and its plan is in data/SPEC.md. Here is how it works, in four ideas.
A seed. A computer’s random numbers come from a starting number, and the same seed gives the same numbers every time. That is why your copy of this book shows the same −12.0% as everyone else’s.
Named streams. Each kind of chance has its own random stream, with its own name and its own seed for each day: rain, app sessions, lost events, refunds, and many more. Adding a new stream moves no other random draw; only numbers that depend on the change itself move. The Riverside fee was added after most of this book was written, as a new stream called riverside_surcharge. A test checks that every table, cut at 5 October, still matches checksums taken before the fee existed. Its change log records the one exception: two small sample files of loyalty tiers.
Planted secrets. The causes of the twelve percent are fixed settings in the program. A rainy day raises orders by 11%. Prices 5% higher cut orders per user by 2% and drinks per order by 3%. And here is the tracking bug, read from the program as this page was built:
# S1: iOS 3.2.0 + Apple Pay checkouts never send order_completed.
platform_name, bug_version, bug_payment = world.BUG_SEGMENT
bug = ((pop.platform[sessions.user] == PLATFORM_CODE[platform_name]) & (version == bug_version)
       & (payment == PAYMENT_CODE[bug_payment]))
n_events = sessions.depth.astype(np.int64) - ((sessions.depth == PAID) & bug)
Line by line:
- A comment: a note for people. The computer skips it.
- Read the three settings that describe the broken phones: iOS, version 3.2.0, Apple Pay.
- For every app session of the day at once, mark it
Trueif the phone is an iPhone, the app is version 3.2.0, and the customer paid with Apple Pay. - (The same line, continued.)
- Each session sends one event for each step it reached. A marked session that reached payment (
PAID) sends one event fewer: the missingorder_completed. The order itself is written to the database as usual.
A few lines of code; seven points of the twelve.
Luck, chosen by search. A fixed setting cannot decide luck, and the story needed some particular luck. So the authors of this book chose some of it by search, and you should know exactly where.
- The August price test. We tried 448 versions of the luck in those fourteen days. Only one, number 111, gave both a “significant” day-3 win for revenue and, at the end, flat revenue with about 2% fewer orders.
- The two case weeks. With the default luck, the drop in completed orders came out at −4.0%. Version 15 of those two weeks’ luck makes it −5.0%. That is what lets the 1.9 points left over land so close to the price test’s 2.1.
- The clean checkout test. We chose the way users were split so that its result lands close to the true +1.5%. Across splits, the measured lift varies by about 0.55 points around the truth.
This is fair for a teaching book: every method here works the same way with any of these versions. But it means that the neat agreement in Chapters 21 and 24 was arranged. Real data would agree less neatly.
A test for every secret. For each secret, the folder tests/ holds a test that runs the right method and checks that it finds the secret, and, where the book says so, that the naive method misses it. The tests run with pytest, the program that runs them all and reports which pass. There are 69 test functions in all. Here is one. Each assert line means: report a failure if this is not true.
def test_s1_true_drop_is_5_percent_so_tracking_gap_is_7_points(con):
    true = m.week_over_week(m.daily_true_orders(con))
    reported = m.week_over_week(m.daily_reported_orders(con))
    assert -0.055 <= true <= -0.045
    # The naive reading (trust the dashboard) overstates the drop by about 7 points.
    gap_points = 100 * (true - reported)
    assert 6.0 <= gap_points <= 8.0
Here are all thirteen secrets, where Mia found each one, and what the naive method would have told her. One of them, S12, was measured, not planted: customers kept coming back at a steady rate, and the book needed to show that.
| Secret | What was planted | Found in chapter | The naive method says | Tests |
|---|---|---|---|---|
| S1 | iOS 3.2.0 with Apple Pay never sends order_completed |
1, 6, 7; proved in 15 | Trust the dashboard: “orders fell 12%” | 4 |
| S2 | The week before the drop was unusually rainy | 16, 17 | Compare with one week: “demand fell 5%” | 2 |
| S3 | A 5% price test, peeked at on day 3, then shipped | 18, 21 | Read the test on day 3: “revenue is up” | 3 |
| S4 | A redirect that loses slow Android phones from one group | 21 (Lie 3) | Skip the split check: a fake win | 2 |
| S5 | A new home screen whose lift fades week by week | 21 (Lie 4) | Judge it on its first week | 1 |
| S6 | A clean test: the one-page checkout | 19, 20, 22 | Nothing to catch: the control case. A test too small would miss it | 1 |
| S7 | Corporate accounts’ bulk orders | 2 | One average for all orders: “a typical order is bigger” | 2 |
| S8 | Matcha stores: better in every city, worse in total | 4 | Pool all cities: “matcha stores convert worse” | 2 |
| S9 | Refunds that arrive weeks later and change past weeks | 11 | Read today’s table as if it were the past | 1 |
| S10 | Loyalty tiers with a sharp line at gold | 12, 23 | Overwrite each tier every night; compare gold members with everyone | 2 |
| S11 | A backfill that ran twice | 13 | Rerun a job that appends: September doubled | 2 |
| S12 | Steady retention (measured, not planted) | 6 | Count customers from app events: “customers are leaving” | 1 |
| S13 | Riverside’s $0.99 delivery fee | 23 | Compare Riverside before and after | 4 |
Every number about Steep in this book came from this program. (A few chapters also use clearly labelled practice simulations, such as Chapter 17’s rain of intervals.)
In a real company, you never see the truth. You see estimates, and you trust the method that made them. In Steep, you can open the program and check. Here are four of Mia’s estimates, next to the setting the program planted.
| What | Planted | Mia’s estimate | 95% interval | Caught? | Chapter |
|---|---|---|---|---|---|
| Normal growth, a week | +0.5% | +0.29% | +0.13% to +0.43% | no | 16, 17 |
| Rain: extra orders on a rainy day | +11% | +11.3% | +10.4% to +12.2% | yes | 16, 17 |
| Prices +5%: change in orders per user | −2% | −2.1% | −3.8% to −0.5% | yes (chosen by search) | 21 |
| Riverside fee: change in Riverside’s orders | −4% | −4.5% | −6.4% to −2.6% | yes | 23 |
The growth missed. The recipe found +0.29% a week, but the program grows Steep by +0.5%. Why? The summer had its own A/B test: in June, half of the users saw a new home screen, and its early boost (Chapter 21, Lie 4) made June look a little high. That bent the recipe’s trend flatter. Fitted without those four weeks, the recipe finds +0.45%. The range could not warn about this, because a range covers luck, not a recipe that leaves out a cause (Chapter 17). With the true growth, the leftover in the ledger would have been 2.1 points instead of 1.9. For Riverside, the fee removes 4% of the consumer orders that would have been placed; corporate orders are untouched, so the true change in all of Riverside’s orders is very slightly smaller.
Two honest catches, one arranged catch, and one miss the range could not warn about. That is closer to real life than a perfect score would be.
Plant your own secret
The best way to learn these methods is to hide something and see whether a friend can find it.
What you need. The book’s source folder, steeped-in-data. Python 3.12 and uv (a tool that installs Python packages), as its README.md explains. About 1 GB of free disk for the data, and a few minutes to build it. On Windows, the commands are below; on macOS or Linux, write .venv/bin/python wherever they say .venv/Scripts/python.exe.
.venv/Scripts/python.exe -m data.generate    # builds the data into data/out/
.venv/Scripts/python.exe -m pytest           # runs every test
Level 1: change one setting. Open steep/world.py, change one planted setting, such as RAIN_MULTIPLIER or the bug’s release date, and build again. Then run the tests, and render a chapter. Read which tests fail, which chapter assert lines stop the build, and why. One test will always complain: tests/test_frozen_past.py guards everything before 5 October, and you changed the past. That is the test doing its job. If you mean the change, rebuild its checksums on purpose, as the file explains.
Level 2: a new secret. Write the test first: what should your friend find, how does the right method find it, and how does the naive one miss it? Run it; it should fail. Then put a function like this in a new file, steep/my_secret.py:
from dataclasses import replace
from datetime import date
import numpy as np
from .arrays import take
from .surcharge import ABANDONED_AT_PAYMENT

DAY, STORE_ID, SHARE = date(2026, 10, 14), "NTG-01", 0.5   # a day between 5 and 25 October

def apply(model, day, sessions, orders, items):
    """A new secret: on one day, half of one store's orders never happen."""
    if day != DAY:
        return sessions, orders, items, np.empty(0, dtype=np.int64)
    gen = model.streams.day("my_secret", day)          # a new name: no other draw moves
    store = model.stores.store_id.tolist().index(STORE_ID)
    hit = (orders.store == store) & (gen.random(len(orders.order_id)) < SHARE)
    depth = sessions.depth.copy()
    depth[orders.session[hit]] = ABANDONED_AT_PAYMENT   # the session stops at checkout
    gone = orders.order_id[hit]
    return (replace(sessions, depth=depth), take(orders, ~hit),
            take(items, ~np.isin(items.order, gone)), gone)
Call it in steep/pipeline.py, in generate(), on the line after surcharge.apply(...), the way the Riverside fee is called, and add its dropped orders to dropped. Pick a day between 5 and 25 October, so the frozen past stays frozen. Build, run the tests, and check that yours now passes and the others still do. Two things will move with it. The store’s receipt numbers that day will have gaps: a clue for your friend. And Northgate is one of Chapter 23’s comparison cities, so that chapter’s estimate will move a little.
Then hand your friend the folder data/out/, the data, but not steep/ or tests/. Give them one question, the way Dana gave Mia hers: “Orders fell. Why?”
Three more ideas:
- An Android bug that drops
checkout_starton one app version. Orders do not fall, but the funnel’s middle step collapses on Android. The naive reading: “checkout got better, because more people who start it finish it.” - A holiday in one city. Orders jump in one city for one day. The naive week-over-week comparison blames the next week for “falling”.
- A store that counts refunds twice. One store’s revenue looks weak. The naive reading blames the store’s staff; a reconciliation with the payments finds the double count.
| English | 中文 |
|---|---|
| synthetic data | 合成数据 |
| seed | 随机种子 |
| random stream | 随机数流 |
| planted secret | 预埋的线索 |
| test (pytest) | 测试 |
Twelve percent of what?
On her first morning, Mia asked Dana a strange question: twelve percent of what?
Now you can answer it. A twelve percent fall in the order_completed events that reached the warehouse. A five percent fall in the orders in the database. And about two points below a normal week, which was Steep’s own doing: the price.
Three answers about one week, and none of them is wrong. Each one counts something different. That was the first lesson of this book, and it is the last: a number is a definition. Before you ask why it moved, ask what it counts.