On Thursday 8 October, Mia put two sheets of paper on the table of the small meeting room. The first was the plan she had written on Friday 18 September, the day Priya asked her to test a new checkout (Chapter 19). The second sheet was blank.
Priya came in with two milk teas and her laptop. Theo came in with a pen and a paper napkin.
“It ended on Sunday,” Priya said. “Did it win?”
“I don’t know yet,” Mia said. “I haven’t opened the results. I wanted us to open them together, with the plan on the table.”
“Why the plan? We all know what we tested.”
“Because the plan says what counts as a win. We wrote it before anyone could see a number. If we choose the rule after we see the numbers, we can always find a way to win.”
Theo drew a small coin on his napkin. “And check the split first.”
Priya laughed and sat down. “Fine. Read it to us.”
The test was called checkout_v2. For two whole weeks, from Monday 21 September to Sunday 4 October, each user who opened the app was sent either to the old three-step checkout or to the new one-page checkout. A coin decided, one flip per user.
“One more thing,” Mia said. “This test is not part of the twelve percent. It started two weeks after the drop. Whatever it shows is news about the future, not an explanation of September.”
The case was still open in her notebook. About 1.9 points of the drop had no explanation yet. The suspect, the price rise of 7 September, was named but not proved (Chapter 18). That would have to wait a few more days (Chapter 21).
ImportantThe big idea
A good A/B test is mostly decided before it starts: the question, the unit, the metrics, the size, and the rule for the decision.
The plan on the table
An A/B test splits users at random into two groups. Group A, the control, keeps the current version. Group B, the treatment, gets the change. Each group is called an arm. A coin decides who goes where. The coin makes the groups alike. Only two things can make them differ: the change, and chance. If the groups end up further apart than chance allows, the change is the only explanation left.
Mia’s plan answered four questions before the test began.
1. The question
A hypothesis is a clear statement that a test can show to be wrong. Steep’s experiment platform stores one for every test. For checkout_v2 it reads: “A one-page checkout raises conversion.”
A good hypothesis names the change (a one-page checkout), the number that should move (conversion), and the direction (up). “Let’s see what the new checkout does” is not a hypothesis. It invites you to look at everything and keep whatever happened to move.
2. Who gets the coin: the randomisation unit
The randomisation unit is the thing the coin is flipped for. At Steep it could be a session (one visit to the app), an order, a user, or even a whole city. Mia chose the user, for three reasons.
One person, one experience. If the coin were flipped for every session, the same person could see the new checkout on Monday and the old one on Tuesday. Tuesday’s behaviour would be mixed up with Monday’s.
The unit matches the question. The question is about people: do more of them order? If you randomise people, you can count people.
Independent units. Two orders from the same person share that person’s habits, so they are not independent facts. Different people are close to independent. (Chapter 21 shows what goes wrong when each order is counted as a separate fact.)
A bigger unit, such as a city, is right only when the two groups would otherwise share something, such as couriers (Chapter 21). Steep has four cities, so a city test would have four units. That is too few to learn much.
Assignment is the moment the coin is flipped and written down. Steep’s platform does not use a real coin. It uses a hash: a fixed recipe that turns the user’s ID, together with the test’s name, into a number. That number picks the group. The result looks random, but it is the same every time for the same user. So a user lands in the same group on every visit and every phone, and nobody can choose a group. A user enters the test at their first visit during the test. This is their exposure, and the platform logs it in the assignments table. Corporate accounts are kept out of every test (Chapter 21 shows why).
3. What counts: one primary metric, a few guardrails
The primary metric is the one number that decides the test. Mia chose conversion: the share of users who completed at least one order between their first visit in the test and the end of the test. The orders come from the orders database, not from app events. So the Apple Pay tracking bug of Chapter 15, which lost app events, cannot touch them.
Secondary metrics help explain the result but do not decide it. Mia listed two: orders per user and revenue per user.
Guardrail metrics are numbers that must not get worse, even if the primary metric improves. A faster checkout might also make mistakes easier. So Mia’s guardrails were:
the cancellation rate: cancelled orders as a share of all orders placed;
the refund rate: refunded orders as a share of orders that were completed, including those refunded later;
revenue per order (average order value, AOV): a cheaper basket would eat into a higher conversion.
She also listed one number that should barely move: app visits per user. Users meet the checkout only after they open the app. So a new checkout cannot make them open it, and app visits should barely move in two weeks. If they move a lot, suspect the test.
4. How many users, how long, and the rule
Chapter 19 tells how Mia sized the test; here is the short version. The baseline was 67% conversion, and Mia and Priya agreed on a minimum detectable effect (MDE) of 2%, with 80% power at alpha = 0.05. That needed about 19,100 users per group at 67% conversion, and about 27,000 per group on day 9, when conversion so far was lower: the first day Steep’s traffic reached it. Mia rounded up to two whole weeks, so the test could in fact see a lift of about 1.52%. Priya’s smallest lift worth knowing, 1%, was out of reach: it would have needed five weeks.
The last part of the plan is the decision rule: what you will do for each possible result, written down before the test starts. Chapter 19 shows the front of Mia’s one-page plan. On the back she had written the rest: the secondary metrics, the guardrails, and the decision rule. Writing the whole plan down in advance, where others can see it, is called pre-registration. It protects you from the most human mistake in testing: deciding what the question was after you have seen the answer.
Plan item
What Mia wrote on 18 September
Hypothesis
A one-page checkout raises conversion.
Unit and split
Users, by a hash of the user ID; 50/50; corporate accounts excluded
Primary metric
Conversion: share of users with a completed order between their first visit in the test and the end
Secondary metrics
Orders per user; revenue per user
Guardrails
Cancellation rate; refund rate; revenue per order. Should barely move: app visits per user
Size
MDE 2% relative, alpha 0.05 (two-sided), power 80%: about 19,100 users per group at two-week conversion. Two whole weeks can see about 1.52%
Duration
14 days, two whole weeks: Monday 21 September to Sunday 4 October. Read once, after the end
Decision rule
First, the split must pass its check (Step 1). Ship if conversion is higher in B with p < 0.05 and no guardrail is clearly worse. Otherwise keep the old checkout
Step 1 · Check the split
“Split first,” Theo said again. Mia opened the counts.
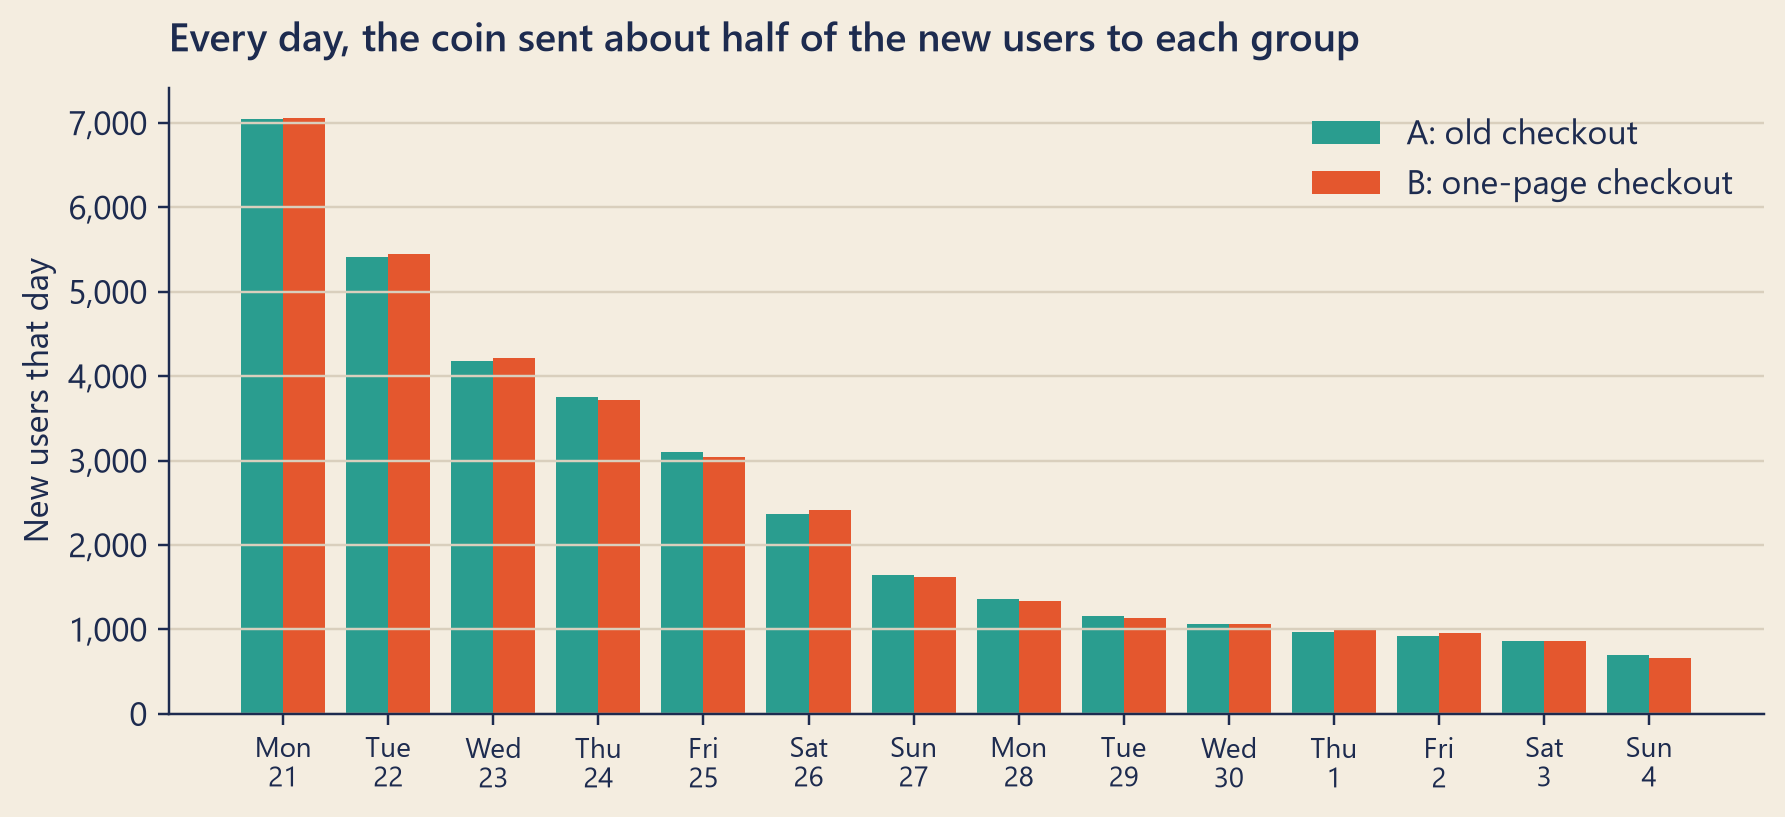
Group A had 34,518 users and group B had 34,527. That is 50.01% in B. A sample ratio mismatch (SRM) check asks whether a gap like this is normal for a fair coin. Here it is: p = 0.973. Mia’s rule calls a split broken only below p = 0.001. The check runs on every test, so a looser line would raise many false alarms, and real SRM bugs give far smaller p-values. Chapter 21 shows what a failed check looks like, and why you must never skip it.
Show the code
fig, ax = bk.figure(8, 3.6)x = np.arange(N_DAYS)ax.bar(x -0.2, by_day["control"], width=0.4, color=bk.TEAL, label="A: old checkout")ax.bar(x +0.2, by_day["treatment"], width=0.4, color=bk.TOMATO, label="B: one-page checkout")ax.set_xticks(x, [f"{d:%a}\n{d.day}"for d in by_day.index], fontsize=9)ax.yaxis.set_major_formatter(mticker.FuncFormatter(lambda v, _: f"{v:,.0f}"))ax.set_ylabel("New users that day")ax.legend(loc="upper right")ax.set_title("Every day, the coin sent about half of the new users to each group")plt.show()
Figure 1: New users entering checkout_v2 each day, by group. Each user is counted once, on the day of their first visit in the test.
Most users entered early: 20% on the first day and 80% in the first week. Frequent customers open the app often, so the coin meets them in the first days. Later days add newer and less frequent customers: only 1,350 on the last day. Mia also checked the split day by day and platform by platform. No single day had a p-value below 0.35, and no platform below 0.64. Many checks need a calm reading. Even when nothing is wrong, the lowest of 14 p-values is about 1/15, or 0.07, by chance. So one day below 0.05 is not an alarm on its own.
Theo had a second question. “Were the groups alike before the test?”
The test data also holds each user’s activity in the two weeks before the test began. Nobody had seen the new checkout then, so any gap is chance. Group B had made 1.2% more app visits in those two weeks (p = 0.086). A coin makes groups alike on average, not identical, and this gap is within what chance does. But it means group B started with a small head start. Mia wrote it down. Chapter 22 shows how to correct for it.
Step 2 · Read the primary metric
Then, and only then, Mia opened the one number the plan said would decide the test.
Conversion
A: old checkout
B: one-page checkout
B minus A
95% interval
p-value
Share of users who ordered
66.10%
67.14%
+1.04 points
+0.34 to +1.74 points
0.004
Relative lift (B ÷ A − 1)
+1.57%
+0.50% to +2.65%
There are two honest ways to say how big a change is. The absolute difference subtracts: B’s share minus A’s share, in percentage points. The relative lift divides: how much bigger B is, as a percentage of A. Here, 67.14% minus 66.10% is +1.04 points. As a share of A’s rate, that is a relative lift of +1.57%. Report both, and always say which one you mean. “Conversion is up 1%” could mean either, and here the two differ by a factor of about 1.5.
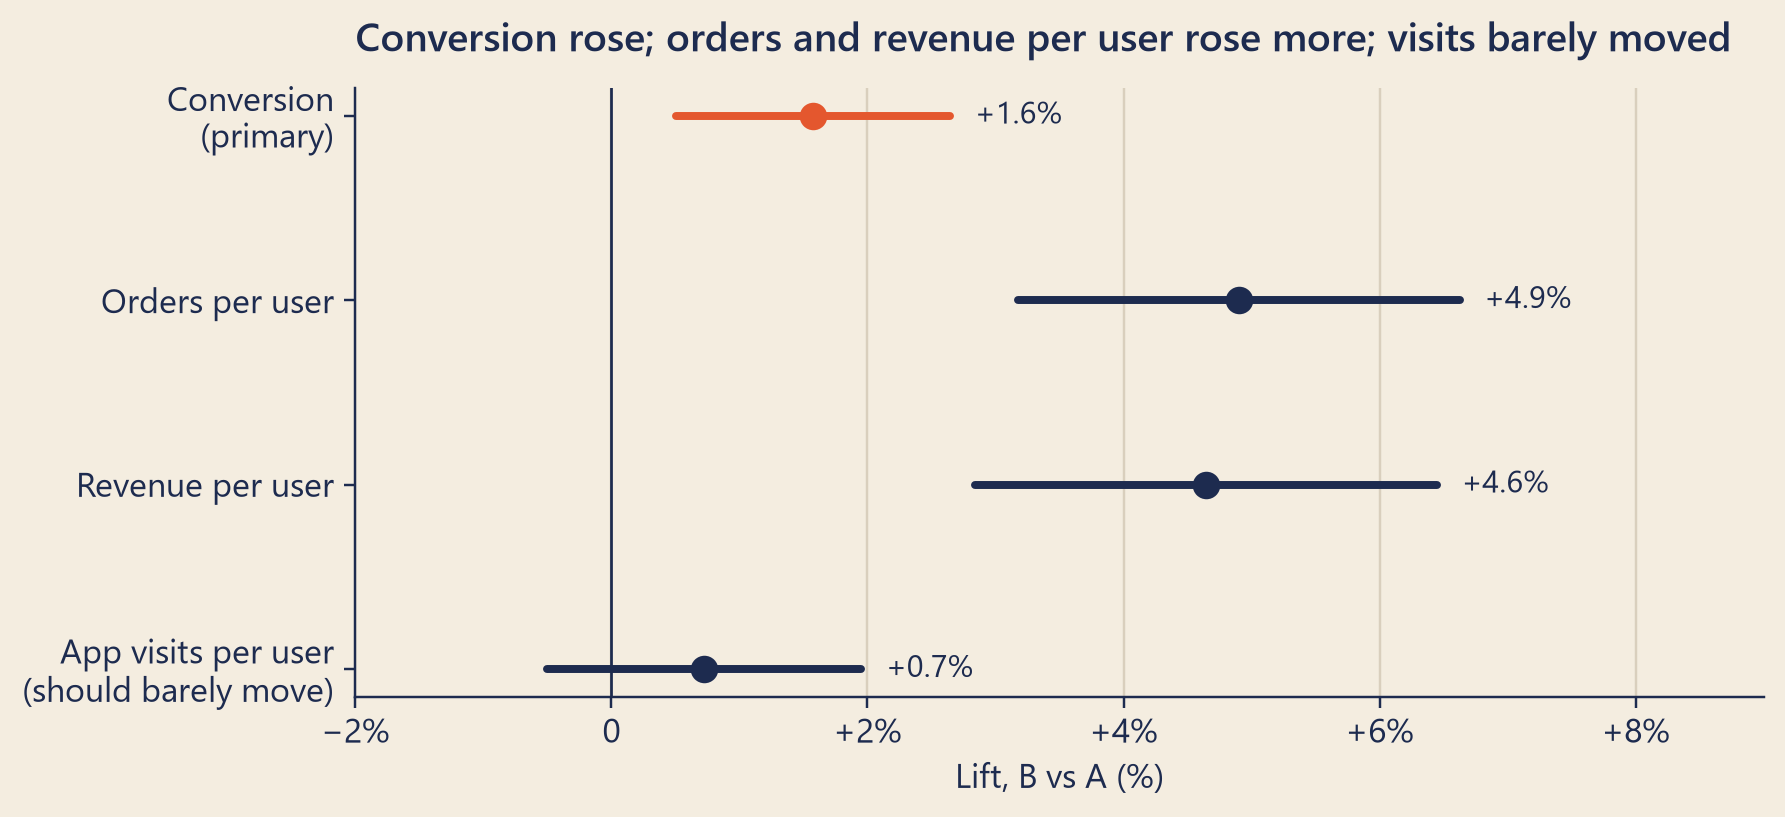
The p-value (Chapter 18) is 0.004. If the new checkout made no difference at all, a gap at least this large would appear less than 1 time in 200. The 95% interval (Chapter 17) runs from +0.5% to +2.6%. That interval is wide. Its low end is smaller than the 1% Priya called worth knowing, and its high end is bigger than the plan’s MDE of 2%. In Chapter 19’s terms, the effect is real, because the whole interval is above zero. It is probably big enough to matter, but not certainly, because the interval reaches below 1%. The test gives strong evidence that the new checkout helps. It does not pin down how much.
The lift also came out below the plan’s MDE. That is not a problem in itself: the MDE is the size the test sees 80% of the time, not the smallest real effect. Chapter 19 gave this test about 79% power for a lift of 1.5%. But when a test can only just see an effect, its estimate tends to be too big (Chapter 19’s winner’s curse). Mia noted it for a second look (Chapter 22).
To make the size concrete: if all 69,045 users in the test had seen the new checkout, about 720 more of them would have ordered at least once in those two weeks.
Priya leaned over the laptop. “Plus 1.6%,” she said. “I hoped for 5%.”
“For conversion, that is about one more buyer for every hundred users,” Mia said. “Our best guess, +1.6%, is above the 1% you said was worth knowing, though the interval still allows as little as +0.5%.”
A note on order statuses (Chapter 1). The tables and charts in this book use each order’s final status, at the end of the data. A scene shows what the characters could see that day. On Thursday, 56 users still counted as buyers. Their orders were refunded later. So Mia saw a lift of +1.58% with p = 0.004: the same answer.
Show the code
rows_plot = [("Conversion\n(primary)", conv_lift, conv_lo, conv_hi), ("Orders per user", *per_user["orders"][1:]), ("Revenue per user", *per_user["revenue"][1:]), ("App visits per user\n(should barely move)", *per_user["visits"][1:])]fig, ax = bk.figure(8, 3.6)for row, (label, mid, lo, hi) inenumerate(rows_plot): color = bk.TOMATO if row ==0else bk.INK ax.plot([100* lo, 100* hi], [row, row], color=color, lw=2.6, solid_capstyle="round") ax.plot(100* mid, row, "o", color=color, ms=8) ax.annotate(pct(mid), (100* hi, row), xytext=(8, 0), textcoords="offset points", va="center", fontsize=10)ax.axvline(0, color=bk.INK, lw=0.9)ax.set_yticks(range(len(rows_plot)), [r[0] for r in rows_plot])ax.invert_yaxis()ax.grid(axis="x")ax.grid(axis="y", visible=False)ax.xaxis.set_major_formatter(mticker.FuncFormatter(lambda v, _: f"{v:+.0f}%".replace("-", "−") if v else"0"))ax.set_xlim(-2, 9)ax.set_xlabel("Lift, B vs A (%)")ax.set_title("Conversion rose; orders and revenue per user rose more; visits barely moved")plt.show()
Figure 2: Relative lift, B vs A, with 95% intervals, for each per-user metric in the plan. Conversion decides the test; the others explain it or check it.
The secondary metrics agree, and rose more: orders per user +4.9% and revenue per user +4.6%. Why more than conversion? Conversion counts a person once, however many times they order. Orders per user also counts extra orders from people who would have ordered anyway. So the new page seems to help at every checkout, not only at the first. That is a reading of the secondary metrics, not a finding: they were not what the test was built to decide.
App visits per user moved +0.7% (p = 0.247), as the plan expected: no sign of a broken test.
NoteUnder the hood
Let \(\hat p_A = x_A / n_A\) and \(\hat p_B = x_B / n_B\) be the conversion rates, where \(x\) counts buyers. The two-proportion z-test uses the pooled rate \(\hat p = (x_A + x_B)/(n_A + n_B)\):
\[z = \frac{\hat p_B - \hat p_A}{\sqrt{\hat p (1 - \hat p)\left(\frac{1}{n_A} + \frac{1}{n_B}\right)}}, \qquad p = 2\,\big(1 - \Phi(|z|)\big).\]
The interval for the difference uses each group’s own variance: \((\hat p_B - \hat p_A) \pm 1.96 \sqrt{\hat p_A(1-\hat p_A)/n_A + \hat p_B(1-\hat p_B)/n_B}\).
The relative lift \(\hat p_B / \hat p_A - 1\) is a ratio, so its interval uses the delta method, a formula for the uncertainty of a ratio (Chapter 21): \(\operatorname{Var}(\hat p_B/\hat p_A) \approx \frac{s_B^2}{n_B \hat p_A^2} + \frac{\hat p_B^2 s_A^2}{n_A \hat p_A^4}\).
Was the net as big as planned? Chapter 19 warns against “power” computed from the effect a test happened to measure. The useful check uses the plan’s MDE instead: with the users the test really got and group A’s real rate, the power for a 2% lift was 96%. That is more than the planned 80%, because two whole weeks brought more users than the nine days the plan needed.
Step 3 · Check the guardrails
A win on the primary metric is not enough. The guardrails must not be clearly worse.
Guardrail
A
B
B minus A
95% interval
p-value
Cancelled, share of orders placed
2.40%
2.50%
+0.10 points
−0.10 to +0.30 points
0.321
Refunded, share of completed and refunded orders
0.98%
1.04%
+0.06 points
−0.07 to +0.19 points
0.360
Revenue per order
$12.16
$12.13
−$0.03
−$0.09 to $0.03
0.356
None of the three is clearly worse: every p-value is above 0.05, and every interval includes zero. Each guardrail is a ratio with orders below the line: cancelled or refunded orders per order, or revenue per order. But the coin chose users, so each interval counts one user, with all their orders, as one unit. The formula that does this is the delta method: a formula for the uncertainty of a ratio that counts each user as one unit (Chapter 21 explains why it matters).
But “not significant” does not mean “safe”. Read the worst end of each interval. The data still allows the cancellation rate to have risen by up to 0.30 points, and revenue per order to have fallen by up to $0.09. Mia judged both small enough to accept. Some teams write such limits into the plan: “cancellations may not rise by more than half a point”. Then the whole interval must stay inside the limit, not only the p-value above 0.05.
Theo pointed his pen at the refunds. “Are those finished?”
They were not. Refunds can arrive weeks after an order (Chapter 1). On Thursday morning, Mia could see 700 refunds on test orders. The refund rate in B was 0.10 points higher (p = 0.087): not clear harm, but not a finished number either. With final statuses (922 refunds up to the end of October), the gap in the table is 0.06 points (p = 0.360). Mia had no way to know that on Thursday. She wrote: Refunds: not finished. Check again later. At the end of October, Mia will re-run the refund check on the same test orders.
Step 4 · Does the effect fade?
A new page can win because it is new. People explore it, and the effect fades once it is familiar. This is the novelty effect, and Chapter 21 shows a real case at Steep. The check is to compare the lift in each user’s first week with their second week, for the same people.
Only the 14,102 users who joined on Monday 21 September had two full weeks in the test. For them, the gain was about the same in both weeks.
Users who joined on day 1
A ordered
B ordered
B minus A
95% interval
Relative lift
In their first week
65.4%
67.6%
+2.21 points
+0.65 to +3.77
+3.4%
In their second week
49.9%
52.2%
+2.38 points
+0.73 to +4.03
+4.8%
The gain did not fade. The relative lift even looks bigger in week 2, but that is arithmetic: fewer of these users ordered in their second week (50% in group A) than in their first (65%), so the same gain in points is a bigger share of a smaller number. Two cautions. Users who join on the first day are the most frequent customers, so this checks them, not everyone. And two weeks cannot show the long run. They can show that the lift did not collapse after its first week.
Step 5 · Decide, then ramp
Mia read the decision rule aloud and ticked each line.
The split passed its check: p = 0.973. ✓
Conversion was higher in B, p = 0.004, below 0.05. ✓
No guardrail was clearly worse. ✓ (Refunds: still arriving.)
“So we ship,” Priya said.
“We ship,” Mia said. “Slowly.”
A ramp-up releases a change in steps: first to a small share of users, then more, then everyone. At each step the team watches the guardrails for a few days. A test with 69,045 users can miss a rare problem, such as a payment failure on one old phone. A ramp catches it while it still touches few people.
A holdout is a small group kept on the old version after the launch, on purpose. Theo wrote the ramp on his napkin: 10% of users, then 50%, then 95%, with 5% kept on the old checkout for four more weeks. The holdout watches the effect over a longer time than the test could. The small holdout is a smoke alarm for the long run, not a ruler: with 5% of users, its interval will be about ±2%. It can catch a big problem, but it cannot measure a lift of 1.6%.
Step 6 · Write it down
By noon, the second sheet was no longer blank. A write-up records what you planned, what you saw and what you decided, with enough detail that someone else could check it. Here is Mia’s, with the numbers as she saw them that morning.
NoteResult · checkout_v2 (EXP-0104), written 8 October
Decision: ship, with a ramp (10% → 50% → 95%) and a 5% holdout for four weeks.
Hypothesis: A one-page checkout raises conversion.
Test: 21 September to 4 October, 14 days. 69,045 users, split 50/50 by user ID. Planned before it began: MDE 2%, alpha 0.05, power 80%.
Trust checks: 50.01% of users in B (SRM p = 0.973). Before the test, B was slightly more active (visits +1.2%, p = 0.086): chance; see the follow-up.
Primary metric: conversion 66.17% → 67.22%, a relative lift of +1.6% (p = 0.004).
Guardrails: none clearly worse. Refunds still arriving: re-run the check at the end of October.
Novelty: no fading from week 1 to week 2 (users who joined on day 1).
Follow-up: re-analyse with the users’ pre-test activity (Chapter 22).
The card is short on purpose. Dana will read the first line. Someone in a year will read the rest, and should be able to run the same queries and get the same numbers. (The card uses Thursday’s statuses; see the note on order statuses in Step 2.)
Try it: the whole test, step by step
This walkthrough runs on the real user file for checkout_v2 in your browser, one row per user. Press Next step to move through the plan. The file holds no order statuses, so it checks what it can: revenue per order and app visits. It uses final statuses, like the tables above.
There is no slider for alpha. The plan fixed it before the test began.
c20View = {const s = c20Stats;const f = c20Fmt;const ok = (good) => good ?"✓":"✗";const parts = []; parts.push(html`<h4>Step 1 · Check the split</h4> <p>A: <strong>${f.int(s.nA)}</strong> users. B: <strong>${f.int(s.nB)}</strong> users (${(100* s.shareB).toFixed(2)}% in B). SRM check: p = <strong>${f.p(s.srmP)}</strong>.${s.srmP>=0.001?"The split is fine.":"Sample ratio mismatch: stop here and find the missing users."}</p>`);if (c20Step >=2) { parts.push(html`<h4>Step 2 · The primary metric: conversion</h4> <p>A: <strong>${(100* s.pA).toFixed(2)}%</strong>. B: <strong>${(100* s.pB).toFixed(2)}%</strong>. B minus A: <strong>${f.pts(s.diff)}</strong> points (95% interval ${f.pts(s.diffLo)} to ${f.pts(s.diffHi)}).<br> Relative lift: <strong>${f.pct(s.lift,2)}</strong> (${f.pct(s.liftLo,2)} to ${f.pct(s.liftHi,2)}), p = <strong>${f.p(s.p)}</strong>.</p>`); parts.push(c20LiftPlot); }if (c20Step >=3) { parts.push(html`<h4>Step 3 · Guardrails and checks</h4> <ul>${s.guards.map((g) =>html`<li>${ok(!g.harm)}${g.label}: A ${g.show(g.a)}, B ${g.show(g.b)} (${g.rel>=0?"+":"−"}${Math.abs(100* g.rel).toFixed(1)}%, p = ${f.p(g.p)})</li>`)}</ul> <p>Cancellations and refunds are not in this file; see the table in Step 3 above.</p>`); }if (c20Step >=4) {const trust = s.srmP>=0.001;const win = s.p< c20Facts.alpha&& s.pB> s.pA;const harm = s.guards.some((g) => g.harm);const verdict =!trust ?"Do not read the result: fix the split first.": harm ?"A guardrail is clearly worse: do not ship; find out why.": win ?"Ship, with a ramp and a holdout.":"Keep the old checkout: no clear win at the planned size.";const segment = c20Who ==="all"?"":"You are looking at one platform: a segment. The plan's decision uses all users. A segment result is an idea for a new test, not a decision (Chapter 21)."; parts.push(html`<h4>Step 4 · Apply the rule</h4> <ul><li>${ok(trust)} Split check passed (SRM p ≥ 0.001)</li> <li>${ok(win)} Conversion higher in B with p < ${c20Facts.alpha}</li> <li>${ok(!harm)} No guardrail clearly worse</li></ul> <p><strong>${verdict}</strong></p>${segment ?html`<p><em>${segment}</em></p>`:""}`); }returnhtml`<div>${parts}</div>`;}
Show the code
c20Db = DuckDBClient.of({users:FileAttachment("../data/out/web/ads_experiment_user_checkout_v2.parquet")})c20Rows = c20Db.query(` select variant, count(*)::double as n, sum(case when converted then 1 else 0 end)::double as conv, sum(orders)::double as o, sum(orders * orders)::double as oo, sum(net_revenue::double) as r, sum(net_revenue::double * net_revenue::double) as rr, sum(net_revenue::double * orders) as ro, sum(items)::double as i, sum(items * items)::double as ii, sum(items * orders)::double as io, sum(sessions)::double as s, sum(sessions * sessions)::double as ss from users${c20Who ==="all"?"":`where platform = '${c20Who}'`} group by variant order by variant`)
Show the code
c20Stats = {const [A, B] = c20Rows.map((r) =>Object.fromEntries(Object.entries(r).map(([k, v]) => [k,typeof v ==="bigint"?Number(v) : v])));const total = A.n+ B.n;const chi2 = (A.n- total /2) **2/ (total /2) + (B.n- total /2) **2/ (total /2);const pA = A.conv/ A.n, pB = B.conv/ B.n;const pooled = (A.conv+ B.conv) / total;const z = (pB - pA) /Math.sqrt(pooled * (1- pooled) * (1/ A.n+1/ B.n));const diffSe =Math.sqrt(pA * (1- pA) / A.n+ pB * (1- pB) / B.n);const vA = pA * (1- pA) * A.n/ (A.n-1), vB = pB * (1- pB) * B.n/ (B.n-1);const liftSe =Math.sqrt(vB / B.n/ pA **2+ pB **2* vA / A.n/ pA **4);const lift = pB / pA -1;// Ratio metrics per user (delta method), and a plain mean for app visits.const ratio = (r, y, yy, x, xx, xy) => {const yBar = r[y] / r.n, xBar = r[x] / r.n;const sY = (r[yy] - r.n* yBar **2) / (r.n-1);const sX = (r[xx] - r.n* xBar **2) / (r.n-1);const sXY = (r[xy] - r.n* xBar * yBar) / (r.n-1);const R = r[y] / r[x];return {value: R,v: (sY -2* R * sXY + R * R * sX) / (r.n* xBar **2)}; };const mean = (r, y, yy) => {const bar = r[y] / r.n;return {value: bar,v: (r[yy] - r.n* bar **2) / (r.n-1) / r.n}; };const guard = (label, a, b, worseIfDown, show) => {const p =c20P((b.value- a.value) /Math.sqrt(a.v+ b.v));const worse = worseIfDown ? b.value< a.value: b.value> a.value;return {label,a: a.value,b: b.value,rel: b.value/ a.value-1, p,harm: worse && p <0.05, show}; };const money = (x) =>`$${x.toFixed(2)}`, two = (x) => x.toFixed(2);// dollars; plain numbersreturn {nA: A.n,nB: B.n,shareB: B.n/ total,srmP:c20P(Math.sqrt(chi2)), pA, pB,diff: pB - pA,diffLo: pB - pA -1.959964* diffSe,diffHi: pB - pA +1.959964* diffSe, lift,liftLo: lift -1.959964* liftSe,liftHi: lift +1.959964* liftSe,p:c20P(z),guards: [guard("Revenue per order",ratio(A,"r","rr","o","oo","ro"),ratio(B,"r","rr","o","oo","ro"),true, money),guard("App visits per user (should barely move)",mean(A,"s","ss"),mean(B,"s","ss"),true, two) ] };}
Show the code
c20LiftPlot = Plot.plot({width:Math.min(width,640),height:120,marginLeft:20,style: {background:"transparent",fontSize:"12px"},x: {label:"Relative lift in conversion, B vs A (%) →",domain: [-4,8],tickFormat: (d) => d >0?`+${d}`: d <0?`−${-d}`:"0"},y: {axis:null,domain: [0,2]},marks: [ Plot.ruleX([0], {stroke:"#1d2b4f"}), Plot.ruleX([100* c20Facts.mde], {stroke:"#8a8f9e",strokeDasharray:"4,3"}), Plot.text([{x:100* c20Facts.mde,y:1.85}], {x:"x",y:"y",text: () =>"MDE",fill:"#8a8f9e",textAnchor:"start",dx:4}), Plot.link([c20Stats], {x1: (d) =>100* d.liftLo,x2: (d) =>100* d.liftHi,y1:1,y2:1,stroke:"#e4572e",strokeWidth:4}), Plot.dot([c20Stats], {x: (d) =>100* d.lift,y:1,r:6,fill:"#e4572e"}) ]})
Show the code
c20Fmt = ({pct: (x, d =1) => (x >=0?"+":"−") +Math.abs(100* x).toFixed(d) +"%",pts: (x, d =2) => (x >=0?"+":"−") +Math.abs(100* x).toFixed(d),p: (p) => p <0.001?"< 0.001": p.toFixed(3),int: (n) =>Math.round(n).toLocaleString("en-US")})// Two-sided p-value of a z-score: erfc(|z| / sqrt 2), Abramowitz and Stegun 7.1.26.functionc20P(z) {const x =Math.abs(z) /Math.SQRT2;const t =1/ (1+0.3275911* x);const poly = t * (0.254829592+ t * (-0.284496736+ t * (1.421413741+ t * (-1.453152027+ t *1.061405429))));returnMath.min(1, poly *Math.exp(-x * x));}
Try the platform menu. Each platform alone has fewer users, so its interval is wider. On a platform with few users, a real effect can fail to reach p < 0.05. This is why the plan’s decision uses all users, and why a segment result is an idea for a new test, not a decision.
Common traps
Randomising sessions or orders. The same person then sees both versions, and the analysis counts one person’s habits as many independent facts. Randomise the people you want to learn about.
Choosing the metric after the results. If orders per user had risen and conversion had not, it would be tempting to call orders per user the “real” goal. That is answering a different question than the one you asked. The plan protects you.
“No significant harm” read as “no harm”. Look at the worst end of each guardrail’s interval, and decide in advance how much harm you can accept.
Reading a number before it is finished. Refunds, cancellations and other slow outcomes keep arriving after a test ends. Say how complete each number is on the day you read it.
Reading early. The plan says to read once, after the end. Chapter 21 shows what happens when a test is read on day 3.
TipAudit Instinct · Plan, perform, report
An audit engagement has three stages, and each leaves a paper trail.
Plan. Before fieldwork, the team assesses risk, sets materiality and writes the audit program: the steps they will perform and the samples they will take. The program is written first, so that the evidence cannot bend it.
Perform. In fieldwork, the team carries out the program and records each step in working papers: what was tested, how, what was found. A good working paper lets a reviewer re-perform the work and reach the same result.
Report. The opinion rests only on the evidence in the working papers, and it states its limits.
An A/B test follows the same life. The plan is the audit program: hypothesis, unit, metrics, size and decision rule, written before the coin is flipped. The checks and the analysis are the fieldwork, and the queries are the working papers. The write-up is the report: one decision, the evidence for it, and what is not yet known, such as refunds that are still arriving.
NoteInterview Corner
1. Walk me through designing an A/B test.
NoteA model answer
Start with a hypothesis that names the change, the metric and the direction. Choose the randomisation unit, usually the user, and check that the groups will not interfere with each other. Pick one primary metric, a few secondary metrics, and guardrails that must not get worse. Size the test from the baseline, the minimum detectable effect, alpha and power, and round the duration up to whole weeks. Write a decision rule and pre-register the plan. At the end, check the split for SRM first, then read the primary metric once with its interval, then the guardrails, then look for novelty. Decide by the rule, ramp the launch, keep a holdout, and write it up so that someone else can reproduce it.
2. How do you pick the randomisation unit?
NoteA model answer
Randomise the unit the question is about, and make sure one unit always gets one experience. For most product changes that is the user: sessions would mix both versions for the same person, and orders from the same person are not independent. Analyse at the unit you randomised, or use the delta method for ratio metrics. Use a bigger unit, such as a city or a time slot, only when units would otherwise share resources and spill over into each other, and accept that you will have fewer units and wider intervals.
3. What are guardrail metrics?
NoteA model answer
Metrics that must not get worse, even if the primary metric improves: for a checkout change, cancellations, refunds, payment errors, revenue per order or page speed. Some check the business, and some check the test itself, such as a metric the change should barely affect, or the SRM check. Read each one’s interval, not only its p-value, and ideally set a limit in advance for how much harm is acceptable. Slow guardrails, such as refunds, need a second read once the late data are in.
Reported change: −12.0% orders, the week of 7 September compared with the week before (CEO dashboard).
Explained so far: 10.1 of the 12 points (95% range 9.8 to 10.4, Chapter 17): the tracking bug (7.0, Chapter 15), the rainy week before (3.4, Chapter 16), and normal weekly growth, which pushes the other way (−0.3, Chapter 16). About 1.9 points are still open (95% range −0.7 to 4.5); Chapter 18 cannot tell them from noise.
Suspects: the 5% price rise for everyone on 7 September (Priya’s price_up_5): not proved.
Ruled out: the matcha menu (Chapter 4); every stop on the data’s journey after the app (Chapters 8–14).
Open questions: What did the price test really show? (Chapter 21.)
New evidence:checkout_v2: good news about the future, not part of the twelve percent (conversion +1.6%, p = 0.004).
Recap
Decide the question, the unit, the metrics, the size and the decision rule before the test, and write them down where others can see them.
On results day, follow the order: split first, then the one primary metric with its interval, then the guardrails (worst end of each interval), then the novelty check.
Ship in steps, keep a small holdout as an alarm for the long run, re-read slow metrics when they are complete, and write a short result that someone else can reproduce.
English
中文
A/B test
A/B 测试
control / treatment
对照组 / 实验组
arm
实验分组(臂)
hypothesis
假设
randomisation unit
随机化单元
assignment / exposure
分组 / 曝光
primary metric
主指标
secondary metric
次要指标
guardrail metric
护栏指标
decision rule
决策规则
pre-registration
预注册
sample ratio mismatch (SRM)
样本比例失衡
absolute difference
绝对差值
relative lift
相对提升
novelty effect
新奇效应
ramp-up
逐步放量
holdout
保留组
write-up
实验结论报告
Further reading
Kohavi, R., Tang, D., & Xu, Y. (2020). Trustworthy Online Controlled Experiments: A Practical Guide to A/B Testing. Cambridge University Press. DOI. The standard practical guide: the unit, metrics and guardrails, trust checks, ramps and holdouts.