On Tuesday afternoon, at 15:10, Priya posted a screenshot in the team chat. It showed the city scoreboard, the report that the city managers read every morning. Revenue for 1 to 27 September: $4,379,529.
Either September was twice as good as we thought, she wrote, or something is broken. I think it is broken.
Two minutes later, Dana forwarded it to Mia with one line: Are your numbers wrong too?
Mia’s case board, her week-over-week numbers and yesterday’s draft slide all used Steep’s data. She opened her notebook and wrote one question: Which of my numbers touched the city scoreboard’s table?
Theo was already walking to her desk. He had read the chat.
“A backfill,” he said, before she could ask. “It ran twice.”
“A what?”
“Running the job again for past days. Since we built each September day, 1,131 of those orders were refunded. Our nightly job only rebuilds yesterday. So this morning we rebuilt all of September. At 14:30, it ran again.”
“And the second run replaced the first?”
“No. It added to it.” He took a napkin and drew a row of boxes joined by arrows, from left to right. “Our nightly jobs replace a day’s data. The last step of this one was written to add rows. Run it once, and September is right. Run it twice, and September is double.”
Mia looked at the napkin for a while. “Then the real question is not who pressed the button the second time. It is why pressing it twice could change the answer at all.”
For the first time that day, Theo smiled. “That is the question I wish more people asked.”
Mia wrote at the top of a new page: Suspect: the pipeline. Which of my numbers came from that table?
ImportantThe big idea
A good pipeline gives the same result no matter how many times it runs.
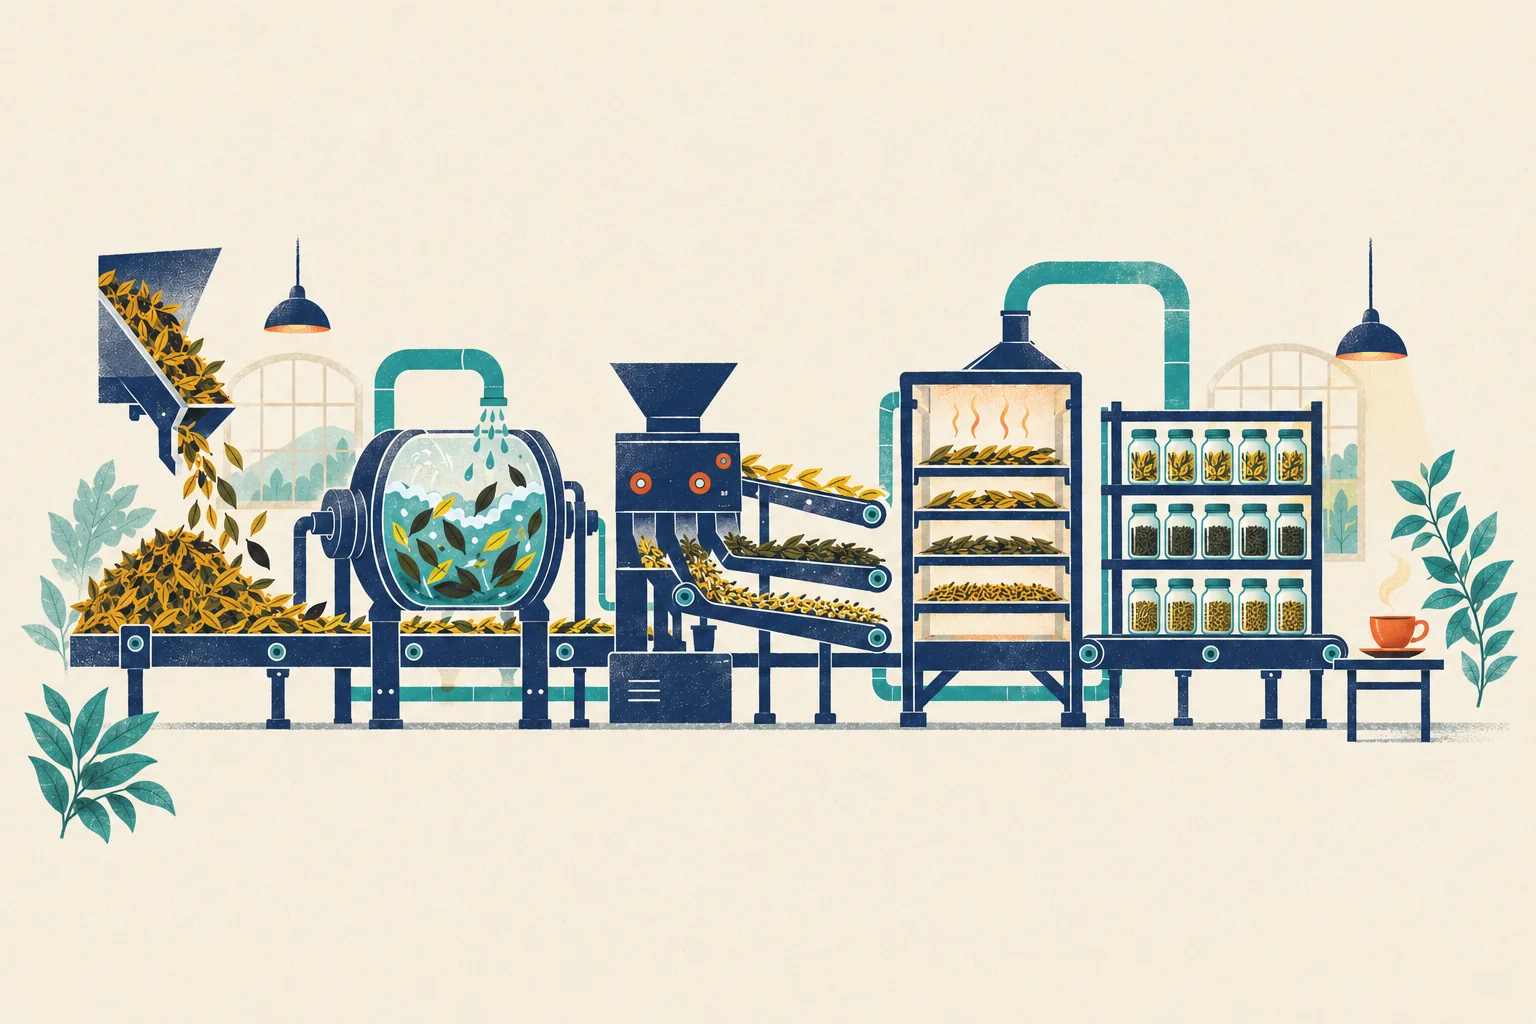
Look at the picture: a tea factory, drawn from left to right. Leaves pour in from a hopper. A drum washes them. A sorter sends them onto three belts. Racks dry them. Jars on a shelf hold the finished tea, and at the end there is a cup. Each machine does one job and hands its work to the next.
A data pipeline is the same idea: a chain of steps that turns raw data into tables people can use. Steep’s pipeline loads raw data (the hopper), cleans it (the drum), sorts and sums it (the sorter and its belts), and stores the results (the jars), so that a dashboard (the cup) can serve them. The picture hides one thing. A real factory runs on a timetable, and someone must decide when each machine starts, and what happens when one of them jams.
ETL and ELT
People who build pipelines often describe them with three letters. ETL stands for extract, transform, load: take data out of a source, change it on a separate machine, then load the finished result into the warehouse. ELT swaps the last two steps: load the raw data first, then transform it inside the warehouse, usually with SQL.
Steep works the ELT way. The ODS layer of Chapter 12 is the raw load, and DWD, DWS and ADS are SQL that runs inside the warehouse. ELT became common when warehouses became cheap and strong enough to do the heavy work themselves. It keeps the raw copy, so you can transform it again when a rule changes, like Mia’s new definition of orders on Monday. ETL still makes sense when data must be cleaned or masked before it may be stored at all, for example to remove personal details.
The night shift: schedulers and DAGs
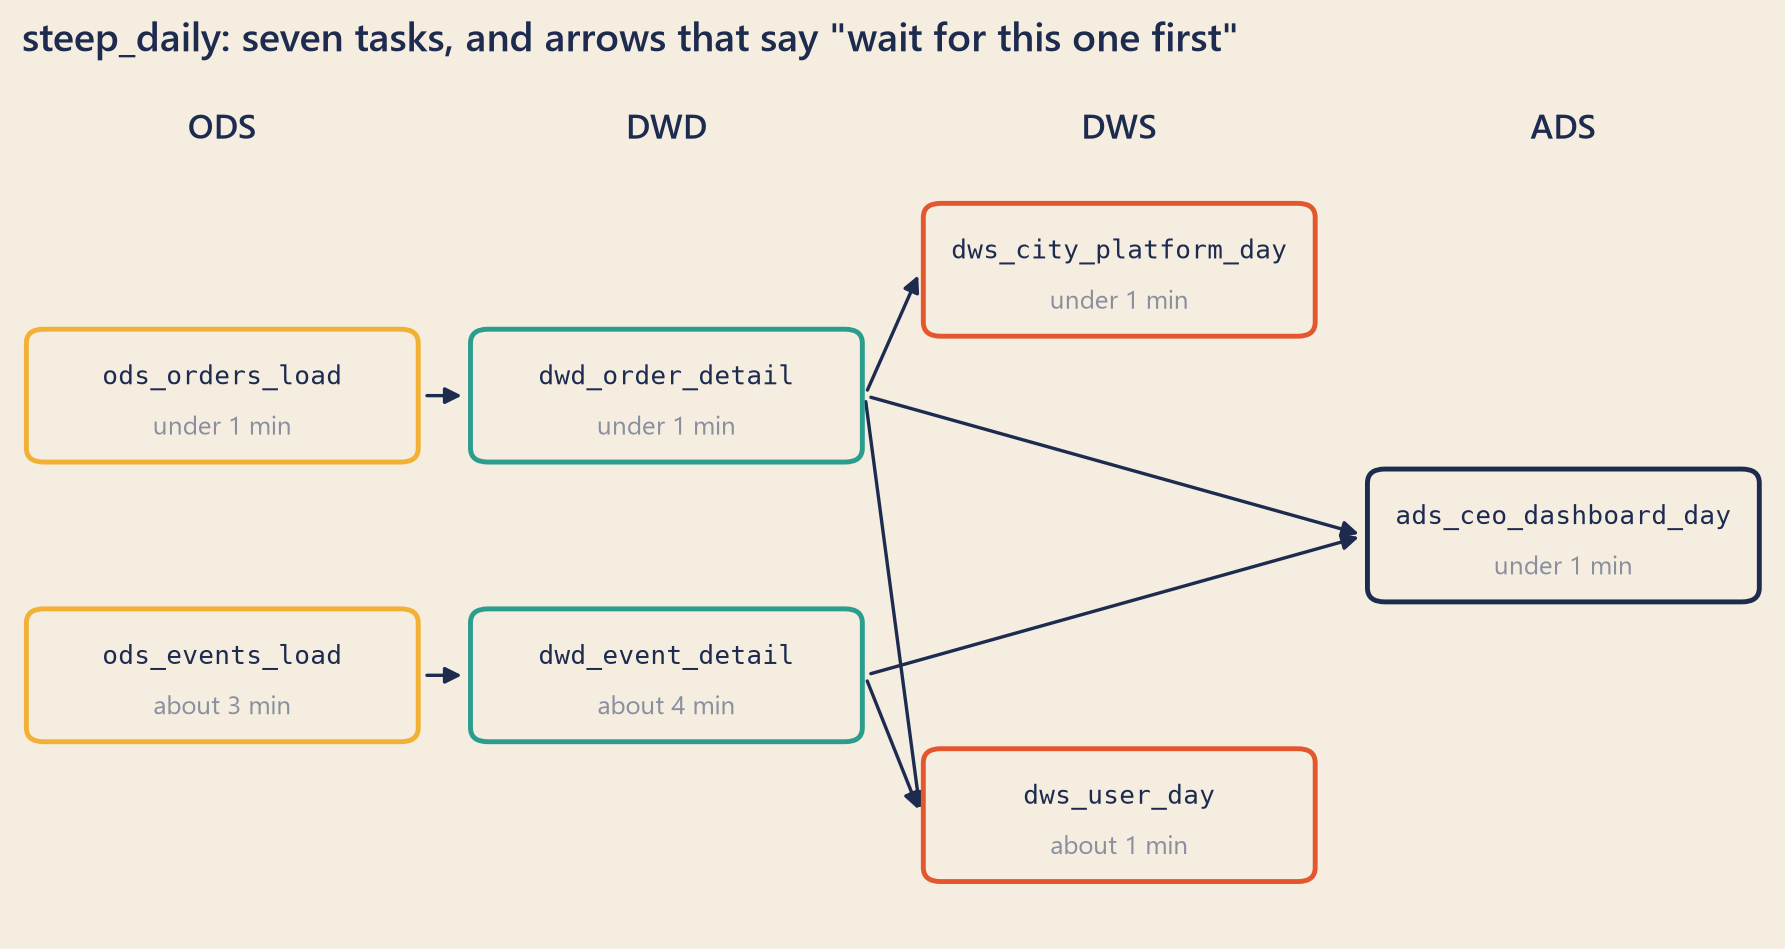
Every night at 02:00, a program called a scheduler starts Steep’s pipeline, named steep_daily. The pipeline has seven tasks, one for each table it fills. A task may start only when the tasks it needs have finished: dwd_order_detail cannot run before ods_orders_load has loaded the orders. A rule like “this one first” is a dependency.
Draw each task as a box and each dependency as an arrow, and you get a DAG, a directed acyclic graph. “Directed” means every arrow points one way. “Acyclic” means no path of arrows leads back to where it started. A loop would mean that a task waits for itself, forever.
Show the code
bk.setup()fig, ax = plt.subplots(figsize=(8, 4.2), layout="constrained")ax.set_xlim(0, 100)ax.set_ylim(0, 60)ax.axis("off")ax.set_title(f"steep_daily: {WORDS[n_task_names]} tasks, and arrows that say \"wait for this one first\"")W, H =22, 9POS = {"ods_orders_load": (11.5, 38), "ods_events_load": (11.5, 18),"dwd_order_detail": (37, 38), "dwd_event_detail": (37, 18),"dws_city_platform_day": (63, 47), "dws_user_day": (63, 8),"ads_ceo_dashboard_day": (88.5, 28)}LAYER_COLOR = {"ods": bk.MUSTARD, "dwd": bk.TEAL, "dws": bk.TOMATO, "ads": bk.INK}for x, label in [(11.5, "ODS"), (37, "DWD"), (63, "DWS"), (88.5, "ADS")]: ax.text(x, 57, label, ha="center", va="center", fontsize=11, fontweight="semibold", color=bk.INK)for task, needs in TASK_PARENTS.items():for need in needs: (x0, y0), (x1, y1) = POS[need], POS[task] ax.annotate("", xy=(x1 - W /2-0.4, y1), xytext=(x0 + W /2+0.4, y0), arrowprops=dict(arrowstyle="-|>", color=bk.INK, linewidth=1.1, connectionstyle="arc3,rad=0.0"))for task, (x, y) in POS.items(): color = LAYER_COLOR[task.split("_")[0]] ax.add_patch(FancyBboxPatch((x - W /2, y - H /2), W, H, boxstyle="round,pad=0.25,rounding_size=1", linewidth=1.6, edgecolor=color, facecolor=bk.PAPER, zorder=3)) minutes = median_minutes[task] when ="under 1 min"if minutes <1elsef"about {minutes:.0f} min" ax.text(x, y +1.3, task, ha="center", va="center", fontsize=8.6, family="monospace", color=bk.INK, zorder=4) ax.text(x, y -2.3, when, ha="center", va="center", fontsize=8.5, color=bk.MUTED, zorder=4)plt.show()
Figure 1: Steep’s nightly pipeline, steep_daily. Each box is one task; an arrow means “wait for this one first”. Times are the median from the run log.
The scheduler’s run log records every task it starts: when, for which day, and how it ended. On Tuesday afternoon, Steep’s log held every night from 1 June to 28 September: 120 nightly runs of seven tasks, and 850 task runs in all. (That is 10 more than 120 × 7. You will see why in a moment.) Steep’s scheduler runs one task at a time, in an order that respects the arrows.
Three tools do most of this work in the real world. Apache Airflow is the best-known open-source scheduler; each DAG is a Python file. Apache DolphinScheduler is popular in China, and many teams there draw their DAGs in a web page. On Alibaba Cloud, DataWorks schedules jobs for MaxCompute, Alibaba Cloud’s data warehouse service, and for other engines. The words differ (a “workflow”, a “node”) but the ideas are the same.
One idea confuses almost everyone. The run that starts at 02:00 on 25 September works on the data of 24 September. Airflow calls that day the run’s logical date. DataWorks calls it the data timestamp, and Chinese teams often say 业务日期 (business date). The run waits until the day is over, so that all of the day’s data has arrived. Some tools date the run by its start time instead. Check which day your run really loads.
Each run then writes exactly one partition (Chapter 9), named by that date: dt=2026-09-24. This one habit makes everything else in this chapter easier. A run, a date and a partition line up, one to one.
When a task fails: retries
Machines fail for boring reasons: a short network break, a busy database, a full disk. Most of these failures go away on their own. So a scheduler can retry a failed task: wait a little, then run it again. In Airflow the settings are called retries and retry_delay. DolphinScheduler has the same two settings on every task: how many times to retry, and how long to wait in between.
In Steep’s run log, 10 task runs failed on their first try. All 10 succeeded on the second try, each one 10 minutes after the failure. That explains the extra 10 task runs. Two of the failures fell in the weeks of the case:
Table 1: The two failed tasks in the case weeks, from Steep’s run log. Times are Steep’s local time.
Data date
Task
First try ended (failed)
Retry ended (success)
Rows in the partition
5 September
ods_events_load
6 September, 02:01
6 September, 02:12
68,072
7 September
ods_orders_load
8 September, 02:00
8 September, 02:10
5,486
In both cases, the retry wrote exactly as many rows as the partition holds: one copy, not two. These failed tries wrote no rows. So even an appending task would have left one copy, by luck, not by design. Every task in steep_dailyoverwrites its partition, and overwrite makes a retry safe even when a try fails halfway. A retry is only safe if running the task again cannot hurt. That property has a name.
Idempotency: the same result every time
Press the call button for an elevator five times, and one elevator comes. The first press calls it; the other four change nothing. An action like that is idempotent (you met the word in Chapter 8): doing it twice has the same effect as doing it once.
A task that writes one day of data can do it in two ways.
Append: add the new rows to whatever is already there. Run it twice, and you get two copies.
Overwrite the partition: replace the whole day with the new rows. Run it twice, and you still get one copy.
In Hive’s SQL, the difference is one word. INSERT INTO appends to the table or partition. INSERT OVERWRITE replaces what is there:
-- Idempotent: run it once or ten times, 24 September holds one copy.INSERT OVERWRITE TABLE dws_city_platform_day PARTITION (order_date ='2026-09-24')SELECT city, platform, count(*) AS orders, ...FROM dwd_order_detailWHERE order_date ='2026-09-24'ANDNOT is_refundedGROUPBY city, platform;-- Not idempotent: every run adds one more copy of 24 September.INSERTINTOTABLE dws_city_platform_day PARTITION (order_date ='2026-09-24')SELECT...;
Airflow’s own guide to good practice says the same thing in other words. Treat a task like a transaction in a database. A task should produce the same outcome on every re-run. Do not use a plain INSERT in a task that may run again, because it can create duplicate rows. And read and write a fixed partition, never “the latest data”, because the latest data changes between runs.
Overwriting a partition is the most common way to be idempotent, but not the only one:
Delete, then insert, in one transaction. Remove the day’s rows and write them again, so that nobody ever sees the gap between the two steps.
Merge on a key (an upsert: update the row if the key exists, insert it if not). This works only if the key is truly unique, such as (order_date, city, platform).
Idempotency also needs fixed inputs. A task that reads “everything up to now” gives a different answer tomorrow, even if its code never changes.
Backfills: running the past again
A backfill runs a pipeline again for dates in the past. Chinese teams call it 补数 (“filling in the numbers”). There are good reasons to do it: a bug was fixed, a new column needs history, a new table needs its first months, or the source changed after the fact, like Steep’s late refunds (Chapter 11).
Every scheduler supports it. In Airflow 3 it is a command, airflow backfill create --dag-id ... --from-date ... --to-date .... DolphinScheduler calls it complement, and lets you run the dates one after another (serial) or several at once (parallel). DataWorks calls it data backfill, and can run the chosen task together with the tasks that depend on it.
A scheduler can also fill some gaps by itself. Suppose it was switched off for three nights. When it starts again, Airflow can create the three missed runs, one for each missed data date. Airflow calls this catchup, and it is off unless you turn it on. Either way, a late run must still work on its own data date, not on “today”. That only works if every task reads and writes the partition for the date it is given.
A safe backfill has six checks.
Start at the first table whose input changed. If the orders changed, start at ODS. Rebuilding DWS alone would copy the old DWD again.
Every task in it overwrites its partition. Check the write mode, not the name of the job.
The tasks downstream run too. If you fix DWS, the ADS tables built from it are still old.
Serial or parallel is a real choice. Steep’s daily partitions do not depend on each other, so they can run side by side. A zipper table (Chapter 12) builds each night from the night before, so its nights must run in order.
Control totals before and after (see below).
Tell the people who use the table. A table that is being rebuilt can be half-empty for a while.
What happened on 29 September
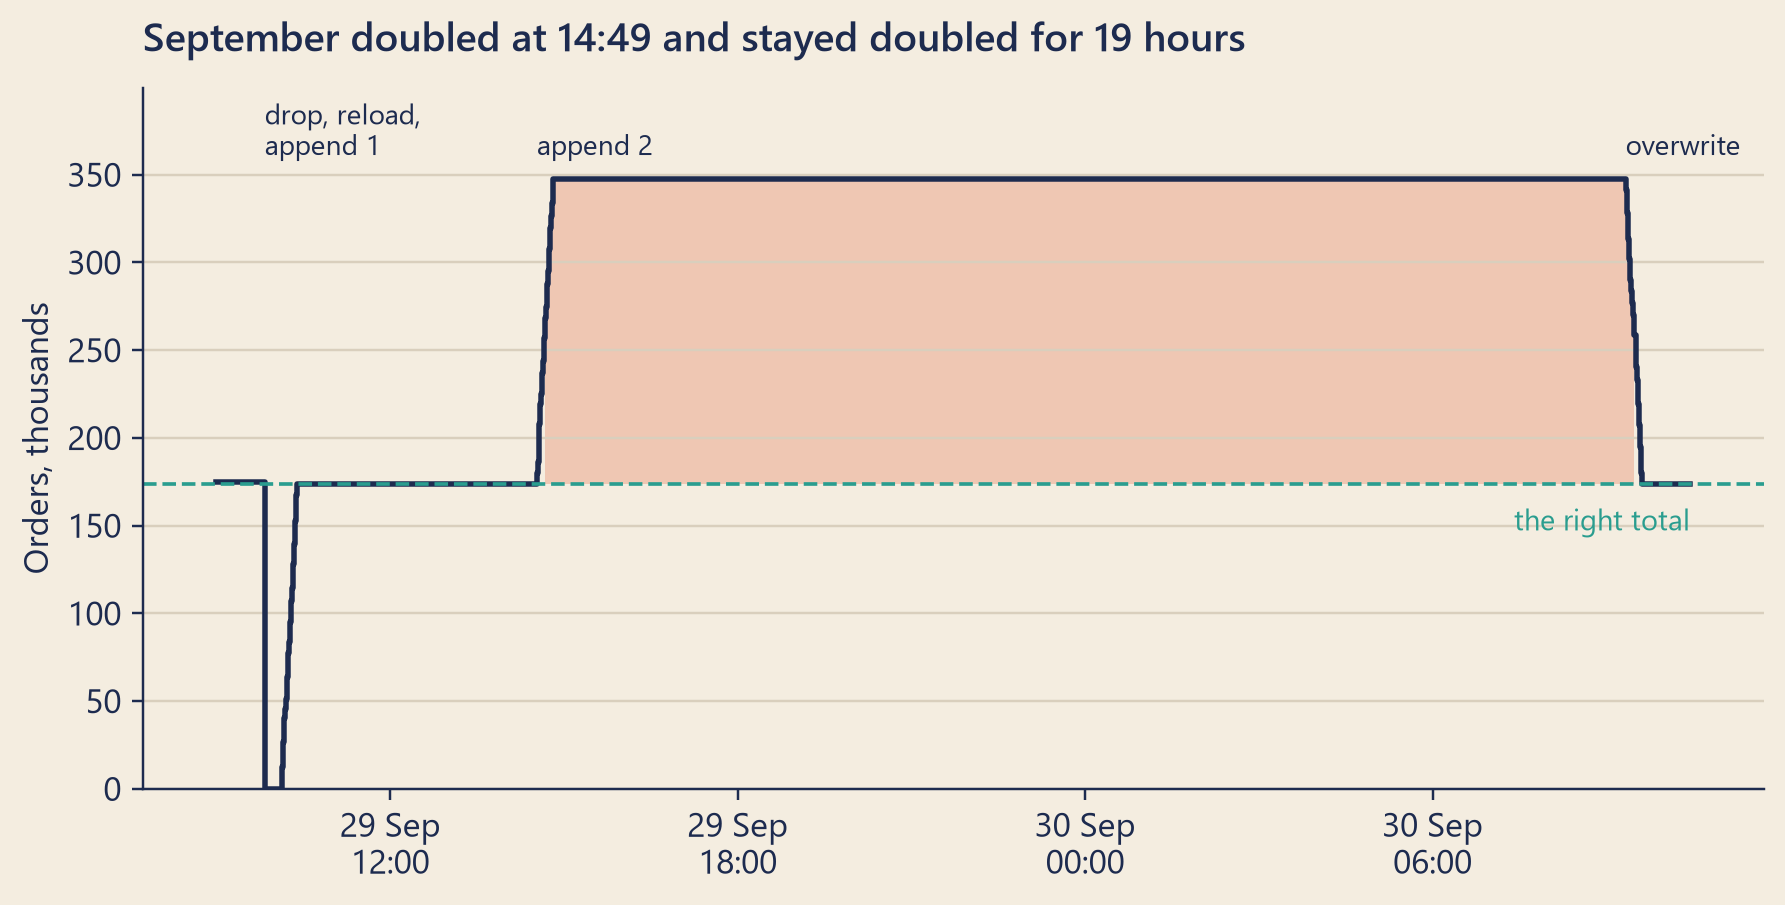
The run log tells the story without anyone’s memory. The backfill job ran twice, at 10:05 and at 14:30. Each run reloaded the orders into ODS and DWD, then appended them to DWS. With the delete before them and the repair the next morning, the log of the backfill pipeline, steep_backfill_dws, shows four runs:
At 09:50 on 29 September, it deleted all 27 daily partitions of dws_city_platform_day for 1 to 27 September.
From 10:05 to 10:23 on 29 September, it reloaded the orders into ODS and DWD for 1 to 27 September (ods_orders_load, then dwd_order_detail), overwriting each day, then it rebuilt dws_city_platform_day in append mode. September was complete, and up to date.
From 14:30 to 14:49 on 29 September, it reloaded the orders into ODS and DWD for 1 to 27 September (ods_orders_load, then dwd_order_detail), overwriting each day, then it rebuilt dws_city_platform_day in append mode. Every September partition of the summary table now held two copies.
From 09:20 to 09:36 on 30 September, it rebuilt dws_city_platform_day in overwrite mode. One copy again.
Every ODS and DWD reload overwrote its day, so running those steps twice did no harm. Only the last step appended: 27 drops, 108 reloads, 54 appends and 27 repairs in all.
Figure 2: Orders for 1–27 September in dws_city_platform_day, replayed from the run log and the binlog. Each step is one partition dropped, appended or overwritten. The dashed line is dwd_order_detail after the morning reload.
For about 19 hours, everyone who read dws_city_platform_day saw September twice. When Priya posted, it said 347,279 orders and $4,379,529. dwd_order_detail, reloaded that morning, said 173,647 orders and $2,189,853. Not exactly twice: the second run reloaded DWD about 4 hours later, and a few more refunds had landed in between. Each day should hold 12 rows, one for each city and platform; each September day held 24.
“Who ran it the second time?” Mia asked.
“An engineer who did not see that the morning run had finished,” said Theo. “People do that. We do not hunt for the person. We fix the job: from today, a backfill job must overwrite, or it does not run.” His team writes a short report after every incident, without blame, so that people tell the whole truth next time.
“Why not repair it now?”
“Because a repair written in a hurry is how a second incident starts. Tonight’s run does not touch September. Tomorrow at 09:20, after a second engineer has read the repair job, we overwrite September once.” Until then, a note at the top of the city scoreboard said that September was being repaired.
Did it touch Mia’s numbers?
Mia answered her own question with the lineage map she had drawn on Monday. Her case numbers came from the orders database and from dwd_order_detail. The dashboard’s line came from dwd_event_detail. None of them reads dws_city_platform_day. Her case board was safe. So was Dana’s wall: its new database line, agreed on Monday, was not live yet, and the old event line reads dwd_event_detail.
She checked what would have happened if it had not been. Computed from the doubled table, the week of the drop would have shown a change of +1.1% instead of −4.9%, the database’s number that afternoon (the case board uses final statuses, see Chapter 1). A small rise instead of a fall. The backfill covered September only. So 31 August had one copy, and the other 13 days had two. A broken table does not always look broken. Sometimes it looks like good news.
There was one more thing, and it worried her. Her new metric views from Monday, orders and net_revenue, read dws_city_platform_day. Her slide numbers had been computed on Monday, before the backfill, so the backfill did not touch them. But anyone who refreshed them that afternoon would have seen double. One place to define a metric is also one place to break it. That is not an argument against a metric layer. It is an argument for checking the layer below it every night.
Control totals: counting between steps
How should the pipeline itself have noticed? With the oldest control in auditing: count things on both sides of every step.
A record count compares the number of rows. Each day of dws_city_platform_day should hold 12 rows. On the evening of 29 September, September’s days held 24 each.
A control total compares a sum. The orders in dws_city_platform_day for a day must equal the completed, not refunded orders in dwd_order_detail for that day. For 1 to 27 September, dwd_order_detail said 173,647 that afternoon. The doubled table said 347,279.
A grain check tests the table’s promise, one row per key (Chapter 12). For 1 to 27 September, the doubled table had 648 rows but only 324 different (order_date, city, platform) keys.
The backfill wrote one day per task. Any one of these checks, run after each task, would have failed at about 14:32, after the first doubled day, and stopped the job. Dashboards that read the table could still have shown that one bad day. Safer still: write to a staging table, a private copy that no report reads, check it there, then swap it in. Instead, the whole table was doubled by 14:49, and Priya noticed it 21 minutes later, by eye. A good pipeline does not depend on someone’s eye.
Promises about time: SLAs and freshness
Correct data that arrives too late is still a problem. Theo’s team has a written promise, pinned at the top of the data team’s page: yesterday’s data is in the warehouse by 07:00, Steep time, every morning. A promise like this is a service level agreement, or SLA. Freshness is how old the newest data in a table is. It is how you check the promise: if at 07:00 the newest day in dws_city_platform_day is not yesterday, the SLA is broken.
Steep keeps its promise with a wide margin. Over 120 nights, the pipeline finished between 02:09 and 02:31. Even the nights with a retry finished long before 07:00.
Schedulers can watch the promise for you: you give a task a time by which it must finish, and the scheduler warns you when it will be late. DataWorks calls this baseline monitoring; the box below has the details for the other tools.
NoteUnder the hood
The data date. For a daily pipeline, the run for data date \(D\) covers the period of data from \(D\) 00:00 to \(D+1\) 00:00, its data interval. It starts after the interval ends, at \(D+1\), 02:00 for Steep. So the data date is the day before the day the run starts. Airflow’s documentation says the same: a run is usually scheduled after its data interval has ended. One trap: many teams set the timetable with a cron schedule, a short code such as "0 2 * * *" that means “every day at 02:00”. In Airflow 3, a cron schedule has no data interval by default, and the logical date is the time the run starts: 25 September, 02:00, not 24 September. Turn data intervals on (the setting is create_cron_data_intervals), or compute the day before yourself. This is a classic off-by-one bug.
Deadlines in each tool. Airflow 2 had an SLA feature; Airflow 3.0 removed it, and Airflow 3.1 replaced it with deadline alerts. DataWorks baseline monitoring predicts a miss from how long the tasks usually take, and warns you early. DolphinScheduler can raise a timeout alarm when one task runs too long.
Why the doubled table showed a rise. Let \(W_1\) and \(W_2\) be the true weekly totals, and let \(a\) be the orders on 31 August, the only day of the two weeks that was not doubled. If both runs read the same DWD, the doubled table gives
The denominator is a little less than \(2W_1\), so the ratio is a little larger than \(W_2/W_1\). Here it is large enough to turn a fall of about 5% into a small rise.
An idempotent merge. On engines with MERGE, an upsert on the grain key looks like this:
MERGEINTO dws_city_platform_day AS tUSING todays_rows AS sON t.order_date = s.order_date AND t.city = s.city AND t.platform = s.platformWHEN MATCHED THENUPDATESET orders = s.orders, net_revenue = s.net_revenueWHENNOT MATCHED THENINSERT (order_date, city, platform, orders, net_revenue)VALUES (s.order_date, s.city, s.platform, s.orders, s.net_revenue);
Run it twice and the second run updates every row to the same values. It does not, however, remove a row that should no longer exist (say, a city with no orders today). Overwriting the whole partition does.
Try it
The first playground is a small copy of Steep’s nightly pipeline. Its partitions hold the real number of orders for each September day, and its control total comes from dwd_order_detail.
The pipeline step-through. The bars are the partitions of dws_city_platform_day for 1–27 September: one bar per day, teal for the first copy, tomato for any extra copy. Days 1 to 20 are loaded. Run the nights that follow, break a task, retry it, and backfill. Every task overwrites its day, except that you can switch the DWS task to append.
pipelineSim = {const C = {teal:"#2a9d8f",tealText:"#1f7a6f",tomato:"#e4572e",tomatoText:"#b8401c",mustard:"#f2b134",ink:"#1d2b4f",paper:"#f4ede0",deep:"#e3d9c4",muted:"#8a8f9e",white:"#fffdf8"};const f = ch13, TICK =380, FAST =90, DWS ="dws_city_platform_day";const N = f.days.length;const fmt = n =>Math.round(n).toLocaleString("en-US");const signed = n => (n <0?"−":"+") +fmt(Math.abs(n));const dayNum = i =>+f.days[i].day.slice(8,10);const modeIn = Inputs.radio(["overwrite partition","append"], {label:"The DWS task writes with",value:"overwrite partition"});const failIn = Inputs.select(["no task",...f.tasks.map(t => t.id)], {label:"Tonight, fail once",value:"no task"});const retryIn = Inputs.range([0,2], {step:1,value:1,label:"Retries allowed"});const fromIn = Inputs.select(f.tasks.map(t => t.id), {label:"A backfill starts at",value: f.tasks[0].id});// Every task downstream of a task, in the scheduler's order (the task itself first).const below = id => {const out =newSet([id]);for (const t of f.tasks) if (t.parents.some(p => out.has(p))) out.add(t.id);return f.tasks.filter(t => out.has(t.id)); };let copies, done, next, status, log, note, queue, timer, busy;functionreset() {clearTimeout(timer); copies = f.days.map((_, i) => (i < f.firstNight?1:0)); done = f.days.map((_, i) =>newSet(i < f.firstNight? f.tasks.map(t => t.id) : [])); next = f.firstNight; status =newMap(f.tasks.map(t => [t.id,"waiting"])); log = []; queue = []; busy =false; note =`1–${dayNum(next -1)} September are loaded. Press "Run tonight's job" to load ${dayNum(next)} September.`; }// A successful write. Only the DWS task can append; every other task overwrites its day.functionwrite(taskId, d, mode, part =1) {if (part ===1) done[d].add(taskId);if (taskId !== DWS) return; copies[d] = mode ==="append"? copies[d] + part : part; }functionaddLog(d, task, attempt, result, mode) { log.unshift(`${f.days[d].day} · ${task} · try ${attempt} · ${result}`+ (task === DWS ?` · ${mode}`:"")); log = log.slice(0,8); }functionplanNight() {const d = next, mode = modeIn.value.startsWith("append") ?"append":"overwrite_partition";const failTask = failIn.value, retries = retryIn.value;const steps = [], broken =newSet(); steps.push([() => { status =newMap(f.tasks.map(t => [t.id,"waiting"])); note =`02:00, the night after ${dayNum(d)} September: the scheduler starts steep_daily for data date ${f.days[d].day}.`; }, TICK]);for (const t of f.tasks) {if (t.parents.some(p => broken.has(p))) { broken.add(t.id); steps.push([() => { status.set(t.id,"upstream_failed");addLog(d, t.id,0,"upstream_failed", mode); }, TICK]);continue; } steps.push([() => status.set(t.id,"running"), TICK]);if (t.id=== failTask) { steps.push([() => { status.set(t.id,"failed");// In this toy, as a loader without transactions can, a failed append leaves half its rows behind.if (mode ==="append") write(t.id, d, mode,0.5);addLog(d, t.id,1,"failed", mode); }, TICK]);if (retries >0) { steps.push([() => status.set(t.id,"up_for_retry"), TICK *2]); steps.push([() => status.set(t.id,"running"), TICK]); steps.push([() => { status.set(t.id,"success");write(t.id, d, mode);addLog(d, t.id,2,"success", mode); }, TICK]); } else { broken.add(t.id); } } else { steps.push([() => { status.set(t.id,"success");write(t.id, d, mode);addLog(d, t.id,1,"success", mode); }, TICK]); } } steps.push([() => { next =Math.min(N, next +1);const c = copies[d];if (broken.size) { note =`The night failed: ${[...broken].join(", ")} did not finish. `+ (c ===0?`${dayNum(d)} September is missing from the summary table, so the 07:00 promise is broken. `:"") + (c >0&& c !==1?"In this toy, as a loader without transactions can, the failed try left part of its rows behind. ":"") +`A backfill that starts at ${[...broken][0]} can repair it.`; } elseif (c !==1) { note =`Every task succeeded, but ${dayNum(d)} September now holds ${c} copies. `+ (failTask === DWS ?"In this toy, as a loader without transactions can, the failed try left half its rows, "+"and the retry appended a full copy on top.":"Append mode added to what was there."); } else { note =`All ${f.tasks.length} tasks succeeded. ${dayNum(d)} September holds exactly one copy.`; }if (failTask !=="no task") failIn.value="no task";// a failure happens once }, TICK]);return steps; }// A backfill reruns the starting task and every task below it, for every loaded day.// A task can only run if every table it reads holds that day.functionplanBackfill() {const last = next -1;const mode = modeIn.value.startsWith("append") ?"append":"overwrite_partition";const chain =below(fromIn.value);const blocked =newMap();// task -> the missing input that stopped it, and on how many daysconst steps = [[() => { status =newMap(f.tasks.map(t => [t.id, chain.includes(t) ?"waiting":"success"])); note =`Backfill of 1–${dayNum(last)} September, from ${fromIn.value} down: `+ chain.map(t => t.id).join(", ") +"."; }, TICK]];for (let d =0; d <= last; d++) { steps.push([() => {for (const t of chain) {const missing = t.parents.find(p =>!done[d].has(p));if (missing) { status.set(t.id,"upstream_failed");const b = blocked.get(t.id) || {input: missing,days:0}; blocked.set(t.id, {input: b.input,days: b.days+1});addLog(d, t.id,1,`skipped: ${missing} is missing`, mode); } else { status.set(t.id,"success");write(t.id, d, mode);addLog(d, t.id,1,"success", mode); } } }, FAST]); } steps.push([() => {const extra = copies.slice(0, last +1).filter(c => c !==1).length;if (blocked.size) {const [task, b] = [...blocked][0]; note =`${task} could not run on ${b.days} day${b.days===1?"":"s"}: its input ${b.input} was missing. `+`Start the backfill at the first table whose input changed or is missing.`; } elseif (extra) { note =`The backfill finished, and ${extra} of ${last +1} days hold the wrong number of copies. `+"Look at the control total."; } else { note ="The backfill finished. Every day holds exactly one copy, however many times you run it."; } }, TICK]);return steps; }functiondrop() {const last = next -1;for (let d =0; d <= last; d++) { copies[d] =0; done[d].delete(DWS); } log.unshift(`dropped the partitions of ${DWS} for 1–${dayNum(last)} September`); log = log.slice(0,8); note =`1–${dayNum(last)} September are gone from ${DWS}. Every report that reads it now shows nothing for September.`; }functionpump() {if (!queue.length) { busy =false;render();return; }const [fn, wait] = queue.shift();fn();render(); timer =setTimeout(pump, wait); }functionstart(steps) {if (busy) return; busy =true; queue = steps;pump(); }// --- drawing --------------------------------------------------------------------------------const dagBox = htl.html`<div class="ps-dag"></div>`;const barBox = htl.html`<div class="ps-bars"></div>`;const totalBox = htl.html`<div class="ps-total" aria-live="polite"></div>`;const noteBox = htl.html`<div class="ps-note" aria-live="polite"></div>`;const logBox = htl.html`<pre class="ps-log"></pre>`;const LABEL = {waiting:"waiting",running:"running",success:"success",failed:"failed",up_for_retry:"up for retry",upstream_failed:"upstream failed"};functiondrawDag() {const layers = ["ODS","DWD","DWS","ADS"]; dagBox.replaceChildren(...layers.map(layer => htl.html`<div class="ps-col"> <div class="ps-layer">${layer}</div>${f.tasks.filter(t => t.layer=== layer).map(t => {const s = status.get(t.id);return htl.html`<div class=${"ps-task ps-"+ s}><span class="ps-id">${t.id}</span> <span class="ps-state">${LABEL[s]}</span></div>`; })} </div>`)); }functiondrawBars() {const W =Math.max(300,Math.min(720, barBox.clientWidth||640));const H =150, L =4, R =4, top =10, base =124;const maxOrders =Math.max(...f.days.map(d => d.orders));const scale = (base - top) / (maxOrders *2.3);const step = (W - L - R) / N, bw =Math.max(4, step *0.72);const shapes = []; f.days.forEach((d, i) => {const x = L + i * step + (step - bw) /2;const one = d.orders* scale;const c = copies[i];if (i >= next) { shapes.push(htl.svg`<rect x=${x} y=${base - one} width=${bw} height=${one} fill=${C.deep} opacity="0.6"/>`); } elseif (c ===0) { shapes.push(htl.svg`<rect x=${x} y=${base - one} width=${bw} height=${one} fill="none" stroke=${C.tomato} stroke-dasharray="3 2"/>`); } else {let y = base;const firstPart =Math.min(c,1); shapes.push(htl.svg`<rect x=${x} y=${y - one * firstPart} width=${bw} height=${one * firstPart} fill=${C.teal} />`); y -= one * firstPart;if (c >1) { shapes.push(htl.svg`<rect x=${x} y=${y - one * (c -1)} width=${bw} height=${one * (c -1)} fill=${C.tomato} />`); } }if (i === next && next < N) { shapes.push(htl.svg`<rect x=${x -1.5} y=${base - one -1.5} width=${bw +3} height=${one +3} fill="none" stroke=${C.mustard} stroke-width="2.5"/>`); }if ([1,5,10,15,20,25].includes(dayNum(i))) { shapes.push(htl.svg`<text x=${x + bw /2} y=${base +15} text-anchor=${dayNum(i) ===1?"start":"middle"} font-size="11" fill=${C.ink}>${dayNum(i) ===1?"1 Sep":dayNum(i)}</text>`); } }); shapes.push(htl.svg`<line x1=${L} x2=${W - R} y1=${base} y2=${base} stroke=${C.ink} />`); barBox.replaceChildren(htl.svg`<svg viewBox="0 0 ${W}${H}" width=${W} height=${H} role="img" aria-label="Partitions of dws_city_platform_day for 1 to 27 September" style="max-width:100%;font-family:Inter,system-ui,sans-serif">${shapes}</svg>`); }functiondrawTotal() {const last = next -1;const inTable = f.days.slice(0, last +1).reduce((s, d, i) => s + copies[i] * d.orders,0);const control = f.days.slice(0, last +1).reduce((s, d) => s + d.orders,0);const wrong = copies.slice(0, last +1).filter(c => c !==1).length;const ok =Math.round(inTable) === control && wrong ===0; totalBox.replaceChildren(htl.html`<div> Orders for 1–${dayNum(last)} Sep in the table: <strong>${fmt(inTable)}</strong>. Control total from <code>dwd_order_detail</code>: <strong>${fmt(control)}</strong>. <span class=${ok ?"ps-ok":"ps-bad"}>${ok ?"✓ They match.":`✗ Off by ${signed(inTable - control)} (${signed(100* (inTable / control -1))}%).`}</span> Grain check: ${wrong ?`${wrong} day${wrong ===1?"":"s"} without exactly ${f.rowsPerDay} rows.`:`every day holds ${f.rowsPerDay} rows.`}</div>`); }const buttons = [];const button = (label, action) => {const b = htl.html`<button type="button" class="ps-btn">${label}</button>`; b.addEventListener("click", action); buttons.push(b);return b; };functionrender() {drawDag();drawBars();drawTotal(); noteBox.textContent= note; logBox.textContent= log.length? log.join("\n") :"The run log is empty.";for (const b of buttons) b.disabled= busy; buttons[0].disabled= busy || next >= N; }reset();const ui = htl.html`<div class="ps-buttons">${button("Run tonight's job", () =>start(planNight()))}${button("Backfill all loaded days", () =>start(planBackfill()))}${button("Drop the loaded days", () => { if (!busy) { drop();render(); } })}${button("Start again", () => { reset();render(); })} </div>`;const resizer =newResizeObserver(() =>drawBars()); resizer.observe(barBox); invalidation.then(() => { clearTimeout(timer); resizer.disconnect(); });render();const style =document.createElement("style"); style.textContent=` .ps-wrap { font-family: Inter, system-ui, sans-serif; color: ${C.ink}; } .ps-controls { display: flex; flex-wrap: wrap; gap: 0.2rem 1.5rem; align-items: flex-start; } .ps-buttons { display: flex; flex-wrap: wrap; gap: 0.4rem; margin: 0.4rem 0 0.6rem; } .ps-btn { font: 600 0.85rem Inter, system-ui, sans-serif; color: ${C.paper}; background: ${C.ink}; border: 0; border-radius: 5px; padding: 0.45rem 0.8rem; cursor: pointer; } .ps-btn:hover { background: ${C.teal}; } .ps-btn:disabled { background: ${C.muted}; cursor: default; } .ps-btn:focus-visible { outline: 3px solid ${C.mustard}; outline-offset: 2px; } .ps-dag { display: grid; grid-template-columns: repeat(auto-fit, minmax(7.5rem, 1fr)); gap: 0.4rem; margin: 0.4rem 0; } .ps-layer { font-size: 0.72rem; font-weight: 600; letter-spacing: 0.08em; color: #5f6475; } .ps-task { border: 2px solid ${C.muted}; border-radius: 5px; padding: 0.2rem 0.4rem; margin: 0.25rem 0; background: ${C.white}; font-size: 0.74rem; } .ps-id { display: block; font-family: "JetBrains Mono", Consolas, monospace; overflow-wrap: anywhere; } .ps-state { font-size: 0.72rem; color: #5f6475; } .ps-running { border-color: ${C.mustard}; background: #fbecc8; } .ps-success { border-color: ${C.teal}; background: rgba(42, 157, 143, 0.15); } .ps-failed { border-color: ${C.tomato}; background: rgba(228, 87, 46, 0.18); } .ps-up_for_retry { border-color: ${C.tomato}; border-style: dashed; } .ps-upstream_failed { border-color: ${C.tomato}; border-style: dotted; opacity: 0.7; } .ps-bars { width: 100%; margin-top: 0.4rem; } .ps-total, .ps-note, .ps-legend { font-size: 0.84rem; margin: 0.3rem 0; } .ps-note { min-height: 2.6em; } .ps-ok { color: ${C.tealText}; font-weight: 600; } .ps-bad { color: ${C.tomatoText}; font-weight: 600; } .ps-legend { display: flex; flex-wrap: wrap; gap: 0.3rem 1rem; color: #3d4766; } .ps-key { display: inline-block; width: 0.9em; height: 0.9em; border-radius: 2px; vertical-align: -0.1em; margin-right: 0.3em; } .ps-log { font: 0.72rem/1.45 "JetBrains Mono", Consolas, monospace; background: ${C.deep}; color: ${C.ink}; padding: 0.5rem 0.6rem; border-radius: 5px; overflow-x: auto; max-width: 100%; white-space: pre; margin-top: 0.4rem; }`;const key = (fill, border) => htl.html`<span class="ps-key" style="background:${fill};border:1.5px ${border}"></span>`;return htl.html`<div class="ps-wrap">${style} <div class="ps-controls">${modeIn}${failIn}${retryIn}${fromIn}</div>${ui}${dagBox}${barBox} <div class="ps-legend"> <span>${key(C.teal,"solid "+ C.teal)}first copy</span> <span>${key(C.tomato,"solid "+ C.tomato)}extra copies</span> <span>${key("transparent","dashed "+ C.tomato)}missing</span> <span>${key(C.deep,"solid "+ C.deep)}not loaded yet</span> <span>${key("transparent","solid "+ C.mustard)}tonight</span> </div>${totalBox}${noteBox}${logBox} </div>`;}
Things to try:
Run two nights. Each task turns teal, and each new day holds one copy.
Make dwd_order_detail fail with 0 retries. The tasks that need it are marked “upstream failed”, but dwd_event_detail still runs: the scheduler follows the arrows. Tonight’s day is missing.
Set the backfill to start at dws_city_platform_day and press “Backfill all loaded days”. The gap stays: DWS cannot run without its input. Now start at dwd_order_detail. The gap fills, and nothing else moves. Press it again. Still nothing moves: that is idempotency.
Replay 29 September: switch to append, drop the loaded days, then backfill twice. The first backfill looks perfect. The second doubles everything, and the control total turns red. Repair it with one overwrite backfill.
In append mode, make dws_city_platform_day fail once with 1 retry. In this toy, as a loader without transactions can, the failed try leaves half its rows behind, and the retry adds a full copy on top. A retry is only as safe as the write it repeats.
This toy is simpler than a real scheduler in one way: it runs one task at a time, like Steep’s. Airflow, DolphinScheduler and DataWorks can run independent tasks side by side.
The second playground is real: Steep’s run log, the doubled table and the correct table, in a small database inside your browser. Two things differ from Tuesday afternoon. The log runs to the end of the data, 25 October, so it also shows the repair and the nights after it. And the copy of the doubled table was rebuilt later from the final data, which already holds the refunds that arrived after 29 September. So it has 345,970 September orders, not the 347,279 that Priya saw. Every September day is still there twice.
The run log, in your browser. Pick a starting query, change it if you like, and press “Run query”. Times in the log are UTC; the queries convert them to Steep’s local time.
runQueries =newMap([ ["Tasks that failed, and their retries",`-- Every task that failed once, with both of its tries. Local time = UTC - 7 hours.WITH failed AS ( SELECT DISTINCT run_id, task_id FROM pipeline_runs WHERE status = 'failed')SELECT CAST(p.run_date AS VARCHAR) AS data_date, p.task_id, p."try", p.status, strftime(p.started_at - INTERVAL 7 HOUR, '%Y-%m-%d %H:%M') AS started_local, p.rows_writtenFROM pipeline_runs AS pJOIN failed USING (run_id, task_id)ORDER BY p.started_at;`], ["29-30 September, run by run",`-- The backfill pipeline: one row per run.SELECT run_id, mode, count(*) AS task_runs, strftime(min(started_at) - INTERVAL 7 HOUR, '%m-%d %H:%M') AS first_start_local, strftime(max(ended_at) - INTERVAL 7 HOUR, '%m-%d %H:%M') AS last_end_local, sum(rows_written)::DOUBLE AS rows_writtenFROM pipeline_runsWHERE dag_id = 'steep_backfill_dws'GROUP BY run_id, modeORDER BY min(started_at);`], ["Control totals: doubled vs correct",`-- Record counts and control totals for 1-27 September, in both tables.SELECT 'incident_dws_doubled' AS table_name, count(*) AS row_count, sum(orders)::DOUBLE AS orders, sum(net_revenue)::DOUBLE AS net_revenueFROM incident_dws_doubledWHERE order_date BETWEEN DATE '2026-09-01' AND DATE '2026-09-27'UNION ALLSELECT 'dws_city_platform_day', count(*), sum(orders)::DOUBLE, sum(net_revenue)::DOUBLEFROM dws_city_platform_dayWHERE order_date BETWEEN DATE '2026-09-01' AND DATE '2026-09-27';`], ["Grain check: keys with more than one row",`-- The table promises one row per (order_date, city, platform).SELECT CAST(order_date AS VARCHAR) AS order_date, city, platform, count(*) AS row_count, string_agg(load_run_id, ', ') AS loaded_byFROM incident_dws_doubledGROUP BY order_date, city, platformHAVING count(*) > 1ORDER BY order_date, city, platformLIMIT 20;`], ["How late did each night finish?",`-- The SLA: yesterday's data by 07:00. The latest finishes first.SELECT CAST(run_date AS VARCHAR) AS data_date, strftime(max(ended_at) - INTERVAL 7 HOUR, '%H:%M') AS finished_local, count(*) AS task_runsFROM pipeline_runsWHERE dag_id = 'steep_daily'GROUP BY run_dateORDER BY finished_local DESCLIMIT 10;`]])
{if (runResult.error) {return htl.html`<p style="color:#b8401c;font-family:Inter,system-ui,sans-serif;font-size:0.85rem">The query did not run: ${runResult.error}</p>`; }const show = v => (v ==null?"": v instanceofDate? v.toISOString().slice(0,16).replace("T"," "):typeof v ==="bigint"?Number(v).toLocaleString("en-US"):typeof v ==="number"? v.toLocaleString("en-US") :String(v));const columns = runResult.rows.length?Object.keys(runResult.rows[0]) : [];return htl.html`<div class="pr-result">${Inputs.table(runResult.rows, {rows:14,layout:"auto",format:Object.fromEntries(columns.map(c => [c, show])) })}</div>`;}
The first query shows every failure and its retry: 11 in the whole log, 10 of them before Priya’s message. Try the others too, then change a date, a table name or a threshold, and run your own.
Common traps
Append in a job that can run twice. Retries, backfills and a second click all run a job again. If it appends, each run adds a copy.
Reading “the latest” data. A task that reads whatever is newest gives a different answer every time it reruns. Read the partition for the run’s data date.
Confusing the run date with the data date. The run on 25 September loads 24 September. Off-by-one bugs here are common and quiet.
Backfilling one table, not its children. Fixing DWS leaves ADS built from the old DWS.
A parallel backfill of a table whose days depend on each other. A zipper table needs its nights in order.
No checks between steps. If the first alarm is a person reading a dashboard, the pipeline has no controls. Count rows, add up totals, and test the grain after every write.
TipAudit Instinct · Batch controls and duplicate postings
Batch controls. Before computers did it for them, clerks sent invoices to data entry in batches, with a slip on top: the number of documents (a record count), the total amount (a control total), and the sum of a field that means nothing on its own, such as all the invoice numbers added together (a hash total). After entry, the system’s totals had to match the slip. Auditors still test these input controls. A pipeline needs exactly the same slip at every step: rows in, rows out, totals in, totals out.
Duplicate postings. Posting the same batch twice is a classic accounting error, and a classic way to hide fraud. Good systems make it harmless: each batch and each document has a unique number, and the ledger refuses a number it has already seen. That refusal is idempotency. Doubled September is a duplicate posting, and overwriting a partition is the control that makes posting twice harmless.
NoteInterview Corner
Q1. How do you make a pipeline idempotent? (如何保证任务幂等?)
NoteA short answer
Make every task a function of its data date: it reads fixed input partitions for that date and fully replaces its output partition. In Hive, use INSERT OVERWRITE ... PARTITION (dt = '...'), never INSERT INTO. Elsewhere, delete and insert the partition in one transaction, or MERGE on a unique key. Never read “the latest” data, and never let a task depend on what an earlier run left behind. Then retries and backfills are safe. Prove it with checks after each write: row counts, control totals against the layer below, and a uniqueness test on the grain key.
Q2. How do you run a safe backfill? (补数怎么做?)
NoteA short answer
Start at the first table whose input changed, and rerun every task downstream of it, so that DWS and ADS are rebuilt from the new DWD. Check that every task in the backfill overwrites its partition. Choose the date range. Decide serial or parallel: partitions that do not depend on each other can run in parallel; anything that builds on the day before, such as a zipper table or a running total, must run in order. Record control totals before and after, and compare them with the layer below. Tell the people who read the tables, and lower the backfill’s priority so it does not delay the nightly run. Airflow (airflow backfill create in Airflow 3, airflow dags backfill in Airflow 2), DolphinScheduler (“complement”, serial or parallel) and DataWorks (“data backfill”) all support this.
Q3. What is the difference between ETL and ELT?
NoteA short answer
ETL transforms data on its way into the warehouse, on a separate engine, and loads only the result. ELT loads raw data first and transforms it inside the warehouse with SQL. ELT keeps a raw copy, so you can re-transform it when rules change, and it uses the warehouse’s own power; it is the common choice today, and layered warehouses (ODS first, then DWD and above) follow it. ETL is still useful when data must be filtered or masked before it may be stored, or when the target cannot do heavy work.
Reported change: −12.0% orders, the week of 7 September compared with the week before (CEO dashboard).
Explained so far: 0 of the 12 points. About 7 of them sit between the orders database and the dashboard (Clue 1).
Suspects: the app, and the service that writes to Kafka (Chapter 8). The iOS app, version 3.2.0, is the main suspect (Chapter 6). Not proved.
Ruled out: the matcha menu (Chapter 4), Kafka (Chapter 8), storage (Chapter 9), computing (Chapter 10), refunds and restatements (Chapter 11), the warehouse layers (Chapter 12), and now the pipeline. The 29 September incident touched one table, dws_city_platform_day, from 14:30 that day, two weeks after the drop was first seen. The case numbers come from the orders database, dwd_order_detail and dwd_event_detail.
Open questions: are the missing order_completed events only late, still on their way? (Chapter 14.) Did iOS 3.2.1, released on 24 September, fix it? How many of the 12 points does it explain? (Chapter 15.)
New evidence: in the case weeks, two nightly tasks failed and were retried, and each retry left exactly one copy of its partition.
Recap
A pipeline is a DAG of tasks that a scheduler runs, usually one partition per data date. Retries and backfills run tasks again, so running again must be safe.
Idempotent tasks overwrite their partition (or delete-and-insert, or merge on a unique key). Appending turned one extra click into a doubled September.
Count between steps: record counts, control totals and grain checks catch a broken load before a person does. An SLA and a freshness check make sure correct data is also on time.
English
中文
data pipeline
数据管道
ETL / ELT
抽取-转换-加载 / 抽取-加载-转换
scheduler
调度器
task
任务
DAG (directed acyclic graph)
有向无环图
dependency
依赖
run log
运行日志
logical date / data date
逻辑日期 / 业务日期
partition
分区
retry
重试
idempotent
幂等
append / overwrite
追加写 / 覆盖写
upsert
更新插入
backfill
补数 / 回填
serial / parallel complement
串行补数 / 并行补数
SLA (service level agreement)
服务等级协议
freshness
新鲜度 / 时效性
record count
记录数
control total
控制总数
hash total
哈希总数
batch control
批次控制
Further reading
Apache Airflow documentation: “Best Practices” (tasks as transactions, no plain INSERT, read and write fixed partitions), “DAG Runs” (data intervals, logical dates, catchup and backfill) and “Tasks” (retries, task states, and the move from SLAs to deadline alerts).
Apache DolphinScheduler documentation, “Workflow Definition”: running a workflow with serial or parallel complement.