Steeped in Data
A Plain-English Guide to Analysis, Pipelines, and A/B Testing
Welcome
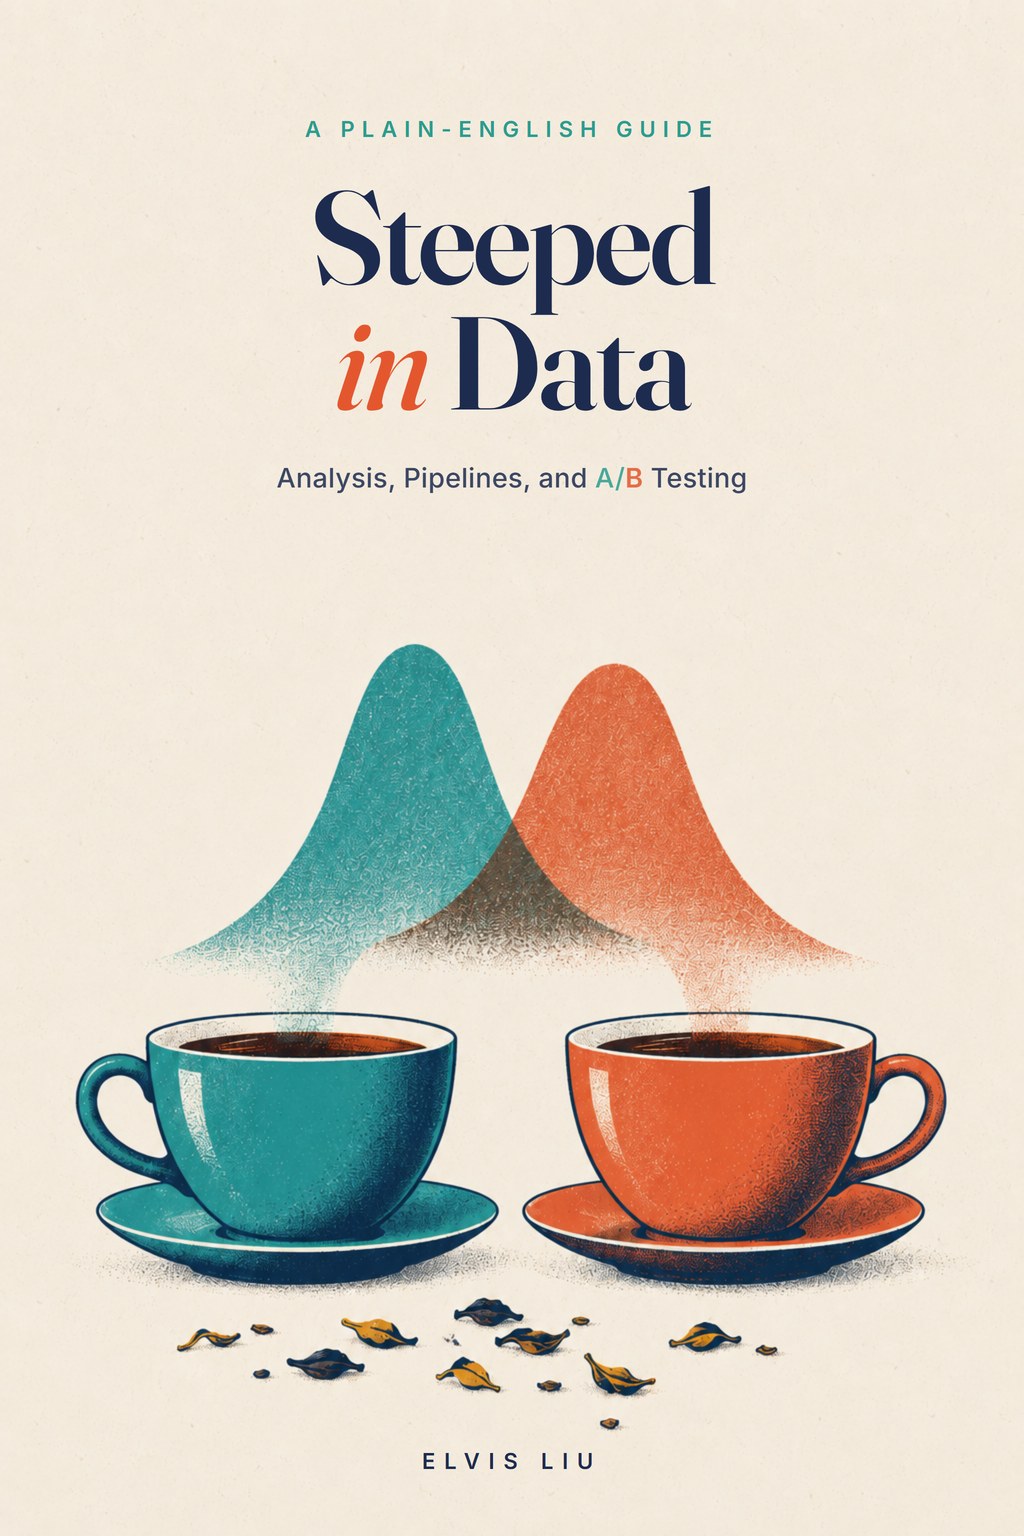
This is a book about working with data, written for people who were never told it could be simple.
It covers three things that usually live in three different books:
- Data analysis: how to look at numbers without being fooled by them.
- Data engineering: how data travels from a tap on a phone to a chart on a screen, through tools like Kafka, Hive, Spark, and Flink.
- Experiments: how A/B tests work, and the many quiet ways they lie.
You do not need a statistics degree. You do not need to know how to code. If you can follow a recipe, you can follow this book.
A book with a case to solve
Everything happens at Steep, a tea-delivery app in four cities. Mia Chen has just left her job as an internal auditor to become Steep’s first data analyst. On her first morning, the CEO asks her a question:
“Orders fell 12% last week. Why?”
Each chapter gives Mia one new clue and gives you one new tool. By the end of the book you will know exactly where the 12% went, and you will have checked every step yourself.
How to read it
- The story comes first in each chapter. The explanation follows.
- Code is optional. Every code block is folded. Open one when you are curious; skip it when you are not. The argument never depends on reading code.
- Try it boxes are live. They run SQL and simulations inside this page, on Steep’s real (synthetic) data.
- Under the hood boxes hold the formulas. They are folded too.
- Audit Instinct boxes show how habits from audit and risk work carry straight into data work.
- Interview Corner boxes collect questions that analysts and data engineers are asked in real interviews.
- Every chapter ends with a small English–Chinese term table (术语对照).
One dataset, no invented numbers
All numbers about Steep come from one generated dataset: orders, app events, experiments, weather, and a small data platform built from them. The data is synthetic, but it behaves like real data, and it hides a few secrets. Every number in the text is computed from the data when the book is built. If you find a number you doubt, open the code and check it. Mia would.
Contents
Every chapter and appendix is ready (✓).
| Part | Chapters |
|---|---|
| ✓ Prologue · Twelve Percent | |
| I · Look Before You Leap ✓ | 1 A Number Is a Definition · 2 The Average Customer Doesn’t Exist · 3 SQL Is Just Asking Precise Questions · 4 The Paradox in the Pantry · 5 Charts That Tell the Truth · 6 Funnels and Cohorts |
| II · The Journey of One Order ✓ | 7 Where Data Comes From · 8 The Ticket Rail: Kafka · 9 Rows, Columns, and Indexes · 10 Too Big for One Machine: HDFS, Hive, and Spark · 11 Lake, Warehouse, Lakehouse · 12 Designing the Warehouse · 13 The Tea Factory: Batch Pipelines · 14 Real Time Is Hard · 15 Trust, but Verify |
| III · Living With Uncertainty ✓ | 16 Randomness Has a Shape · 17 How Sure Are You? · 18 The Surprise Meter · 19 Big Enough to Matter |
| IV · The Art of the Experiment ✓ | 20 Your First A/B Test · 21 Seven Ways an A/B Test Lies · 22 Faster, Smarter Tests · 23 When You Can’t Flip the Coin |
| V · From Numbers to Decisions ✓ | 24 The One-Page Memo · Epilogue · Friday |
| Appendices ✓ | A SQL Pocket Reference · B Statistics Cheat Cards · C A/B Test Checklists · D The Data Platform on One Page · E Interview Question Bank · F English–Chinese Glossary · G Further Reading |