24 · The One-Page Memo
On Tuesday 27 October, at 7 pm, Mia finished her report for the board of directors. It was nine pages long.
It had everything: her first morning and receipt A1024, the three teams’ definitions, the trip through Kafka and the warehouse, the rain, the price test, Riverside, and every chart she had made since September. Most paragraphs began the same way: First I looked at… Then I found… Next I checked…
She printed a copy for her notebook and emailed the file to Dana: For Friday. Everything is in it.
On Wednesday morning, Dana read it on her phone on the way to work. She read the first paragraph and stopped. At 8:40 she was at Mia’s desk.
“This is very good work,” she said. “And I can’t use it.”
Mia waited.
“I have five minutes before the board, and so do they. One page. What happened, how sure are you, what should we do. In that order.” She held up the phone. “Page one tells me about your first morning. The answer is on page nine. Nobody will reach page nine.”
“Everything on it is true,” Mia said.
“I know. That is why I want it on one page, where they will see it.”
Theo did not look up from the next desk. “Nine pages is the trip. Dana wants the address.”
When Dana had gone, Mia took a blank sheet and wrote one line at the top: Orders fell 5%, not 12%. Then she looked at it for a long time.
ImportantThe big idea
A finished analysis is one page someone can act on: the answer first, then how sure you are, then what to do. Everything else goes in an appendix.
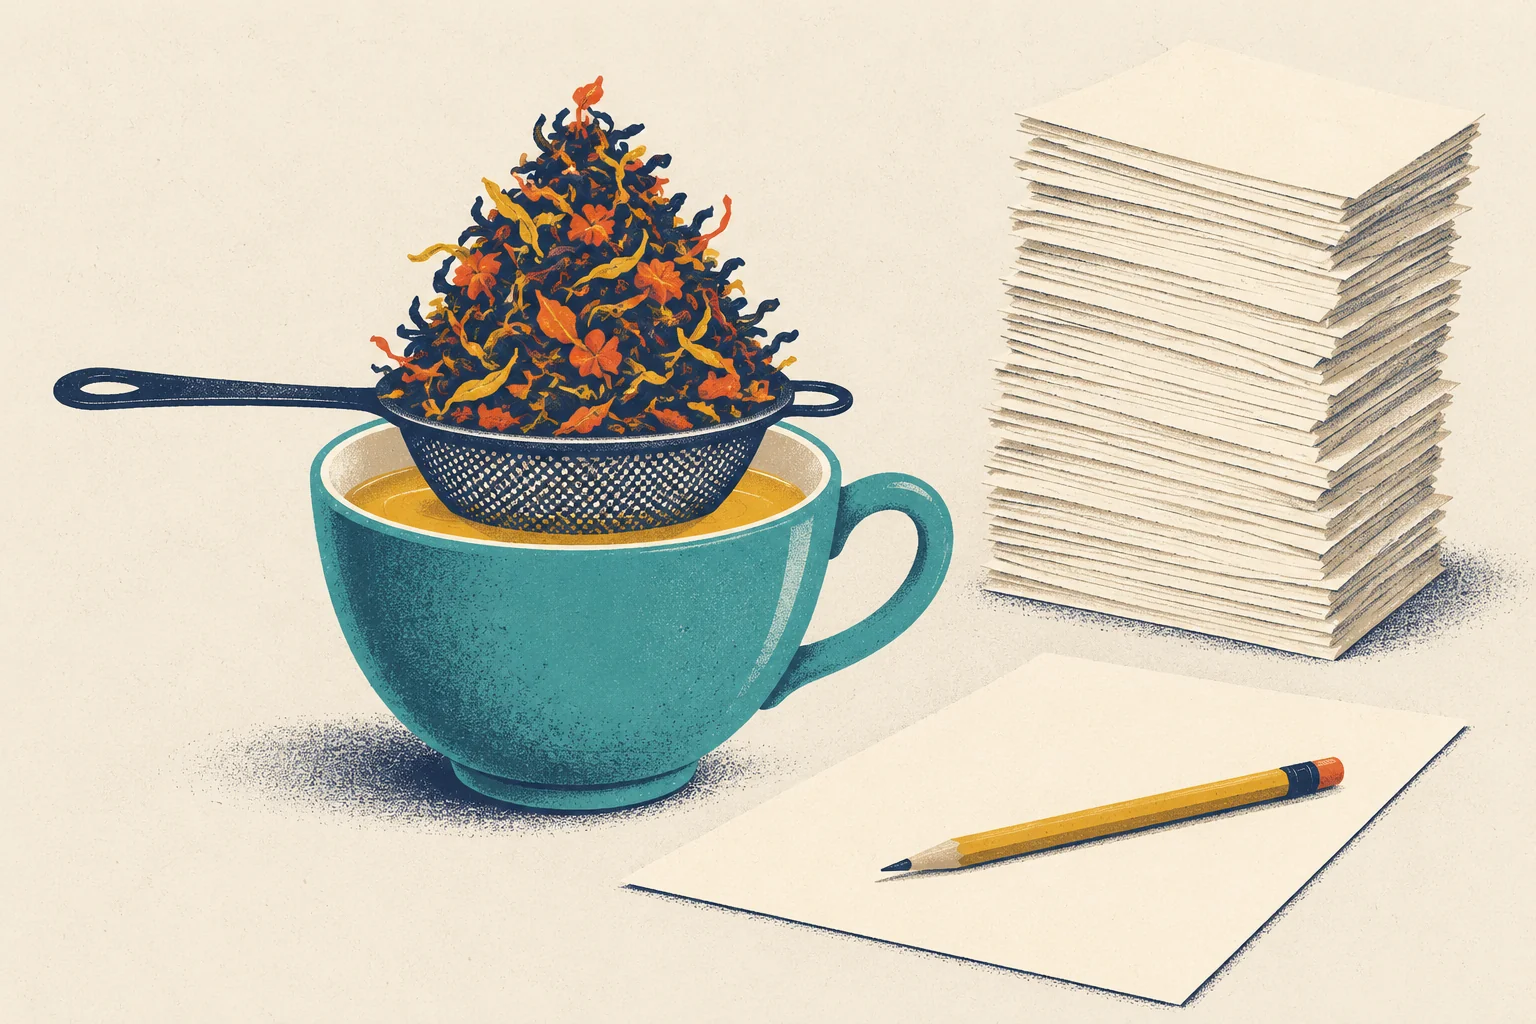
Look at the strainer in the picture: a tall heap of leaves above, clear tea below. Beside the cup lies one sheet of paper, and behind it a tall stack. Mia’s nine pages are the stack; the board needs the one sheet. This chapter is about how to strain one into the other.
The journey draft
Here are the first two paragraphs of Mia’s nine-page draft.
On Monday 14 September, my first day, I began with a question: twelve percent of what? First I looked at how three teams count orders. The dashboard counts order_completed events from the app. Finance counts completed orders in the orders database. Operations counts every order. Then I compared each team’s count for the week of 7 September and the week before. The dashboard fell 12.0%; finance’s count fell 5.0% (final statuses).
Next I built a funnel by platform and saw that its last step fell on iOS after 7 September. Then I followed my own order, A1024, which had no order_completed event. I checked the event stream, the data lake and the warehouse layers, one by one…
Nothing here is wrong. But it is in the order Mia found things, not the order Dana needs them. This is a journey memo: a report that retells the analysis as a story, from the first step to the last. The writer lived it in that order; the reader wants to know where the trip ended.
Barbara Minto, who taught consultants to write at McKinsey, called the fix the pyramid principle. Put the one main point at the top, where it answers the question already in the reader’s mind. Minto finds that question in three steps: the situation the reader knows (the dashboard showed orders down 12%), the complication, the change that creates the question (the dashboard and the orders database disagree, and the board meets on Friday), and the question itself (what happened, and what should we do?). Under the main point go the few reasons, and under each reason, its evidence. Military writers call this bottom line up front; in business, the top is the executive summary.
Here is Mia’s story as a pyramid, grouped under the book’s three questions:
- Answer: Counted orders fell 5%, not 12%. The only lasting loss was the price rise. Keep the price while a longer test measures profit.
- Measured wrongly? The tracking bug: 7.0 points. Counted (Chapter 15).
- An unfair comparison? The rainy week before: 3.4 points, less 0.3 for normal growth. Estimated (Chapters 16–17).
- A real change? The price rise: about 2 points. Tested (Chapter 21).
The nine pages are still useful: they become the evidence at the bottom of the pyramid, in the appendix.
A headline that says “so what”
Mia’s first title was “Analysis of the September decline in orders”. That is a topic: it says what the page is about. A headline is one or more full sentences that say what the page found and why it matters, the “so what”. Here is a test: a reader who reads only the headline should know what happened and what is recommended.
| A first line Mia tried | What is wrong with it |
|---|---|
| “Analysis of the September decline in orders” | A topic. It finds nothing. |
| “Orders fell 12% in the week of 7 September” | A finding, but the dashboard’s. For the business, it is wrong. |
| “Several factors contributed to the change in orders” | True, and it tells the reader nothing. |
| “Orders fell 5%, not 12%, and most of that was a rainy comparison week. The only lasting loss, about 2% of orders, came from our price rise. We recommend keeping the price while a longer test measures its effect on profit.” | The answer, the correction, and the recommendation. |
The last headline is three sentences, and that is fine: a headline is judged by what it lets the reader do.
Counted, estimated, recommended
The memo makes three kinds of statement, and each needs different words.
What we counted. In the week of the drop, 3,361 orders from iOS 3.2.0 paid with Apple Pay had no order_completed event: every one of them. That is a count. It needs a definition (Chapter 1), not a range (Chapter 17).
What we estimated. The rain’s 3.4 points come from a model of what a normal week looks like (Chapter 16). Another summer of data would have given a slightly different number. So an estimate always travels with a range: 3.1 to 3.7 points.
What we recommend. “Keep the new price for now” is not a result. It is a judgement: a choice that uses the results plus things the data does not hold, such as costs and Steep’s plans. Say plainly which sentences are judgements.
Do not mix the three in one sentence. “The bug and the rain explain 10.4 points” adds a count to an estimate, and the reader cannot tell which part is certain.
The price piece has two numbers. What is left after the bug, the rain and growth is 1.9 points; the August test, measured separately, says 2.1 (range 0.5 to 3.7). They agree. Mia said this once, and after that wrote “about 2 points”.
Saying uncertainty in plain words
Dana’s second question was “how sure are you?” Mia used two habits from Chapter 17 and one new one.
1. Give the range, and say what it is a range of. “Orders per user fell 2.1% (95% interval: a fall of 0.5% to 3.8%)” is half a sentence. The other half: the range covers the luck of which app users landed in which group in August, not a change in customers since then.
2. Round to what you know. To two decimals, the dashboard’s change is −12.01%. That is exact arithmetic on a count, but the extra digits help no reader, and they make the estimates next to them look equally precise. Mia used whole numbers in the headline and one decimal in the ledger.
3. Words for chance need numbers. Sherman Kent, an analyst who led the CIA’s national estimates, learned this the hard way. In 1951 his team wrote that an attack on Yugoslavia by the Soviet bloc that year was a “serious possibility”. Asked later what they had meant, members of the team gave answers from about 20% to about 80%. Kent proposed tying each word to a range of numbers: “probable” would mean about 75% (see Further reading). If you use such a word, say once what number you mean. Mia’s memo uses none. It gives ranges, read as in Chapter 17: a range the data fit, made by a method that catches the true value 95 times in 100, not “a 95% chance that the truth is in this range”.
Try it: say it with a range
Pick a metric from the August price test and a confidence level. The playground builds the interval and a sentence that states it correctly.
Things to try: set orders per user to 99%. The range now reaches past zero, which matches the p-value of 0.012 from Chapter 21: below 0.05, but not below 0.01. Then switch to revenue per user: at every level, the data fit a small loss, a small gain, or nothing.
One chart for the main claim
The memo has room for one chart, and it should carry the main claim. Dana’s question, “how do you get from 12% to 5%?”, is about pieces that add up. The chart for it is a bridge chart, also called a waterfall chart: it starts with one total, and each piece is a floating bar that starts where the last one ended.
Show the code
draw_bridge()
plt.show()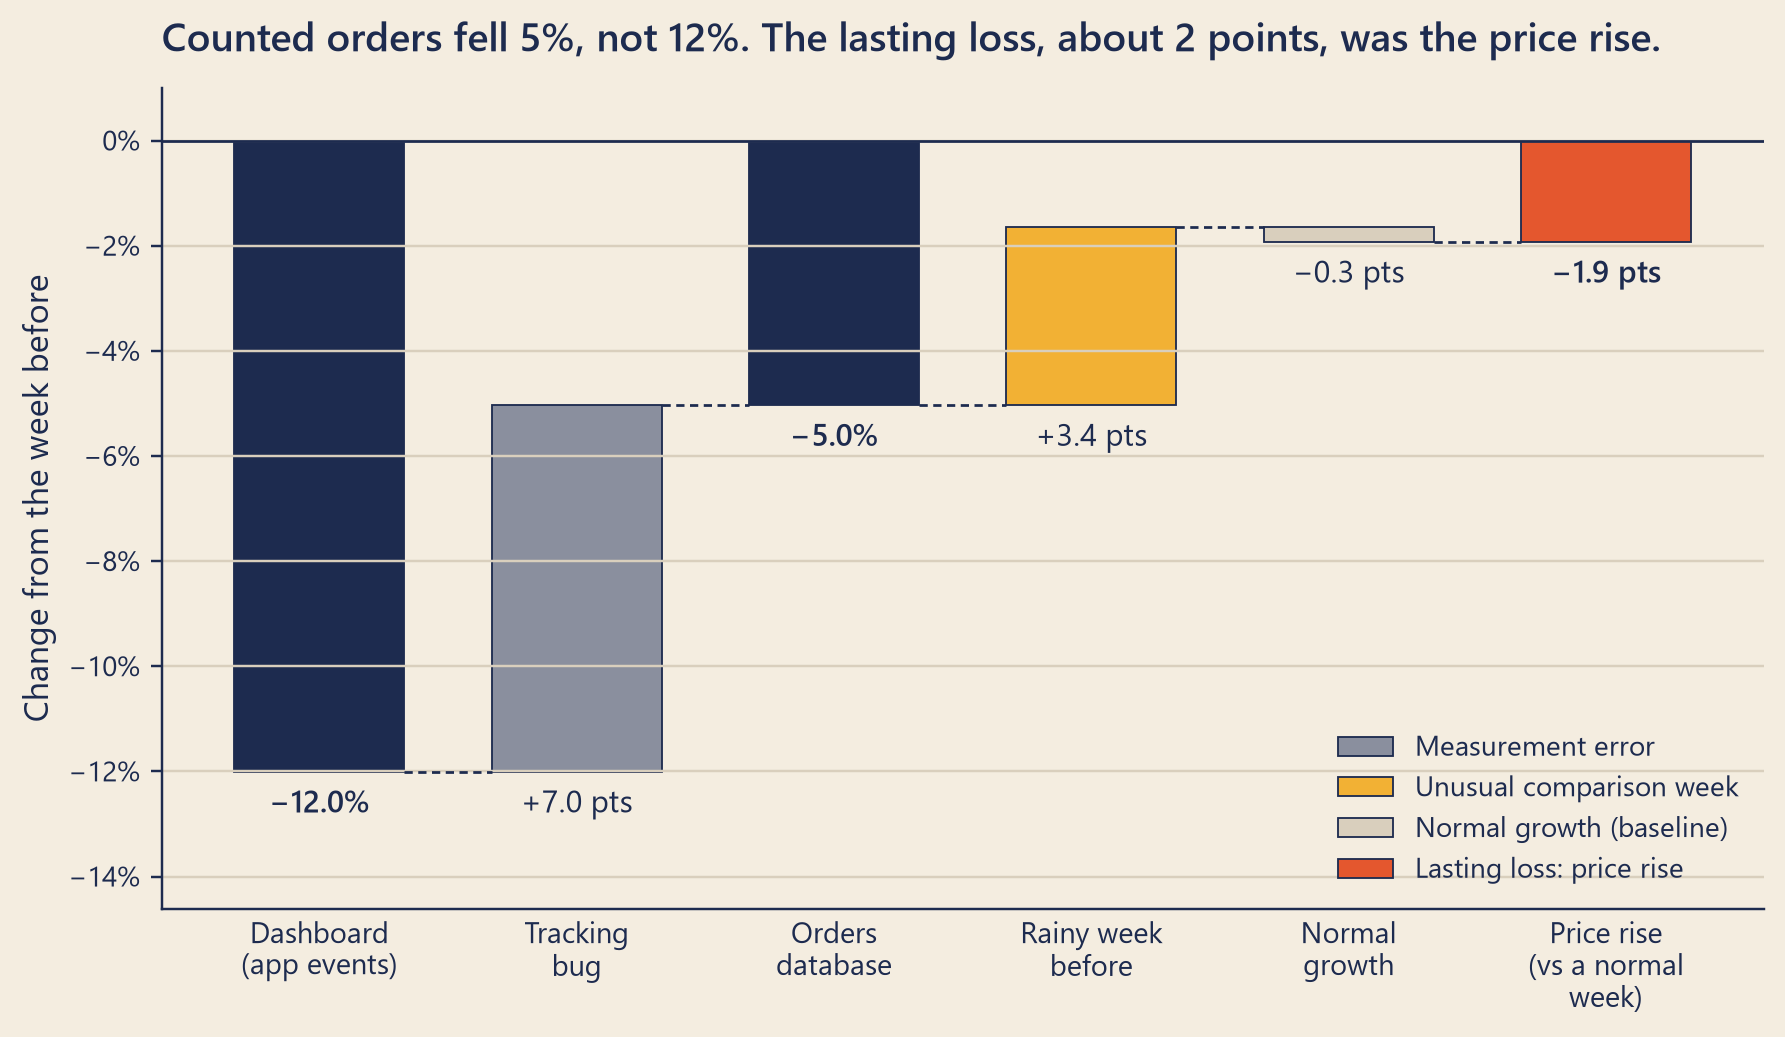
The chart follows the Prologue’s three questions. Is it measured correctly? The grey bar takes out the tracking bug: the dashboard’s −12.0% becomes the database’s −5.0%. Is the comparison fair? The mustard bar takes out the rainy week before (rain brings more orders). A normal week also grows a little, so the real shortfall is 0.3 points larger: the pale bar. What really changed? The tomato bar is what is left: 1.9 points below a normal week, the lasting loss from the price rise.
The title states the finding (Chapter 5), and the colours carry meaning: grey for an error in counting, mustard and pale for the comparison, tomato for the one loss Steep caused. No bar says that orders were not real. The rainy week’s orders were real; they were not a loss Steep caused.
NoteUnder the hood
Why the ledger adds up exactly. Let \(r_d\) be the dashboard’s change and \(r_t\) the database’s, both as W2/W1 − 1. Let \(g\) be the recipe’s normal growth for one week and \(w\) the rain’s effect in points/100, so the recipe expected a change of \(e = g - w\). The four pieces, in points, are
\[\underbrace{100(r_t - r_d)}_{\text{bug}} + \underbrace{100\,w}_{\text{rain}} - \underbrace{100\,g}_{\text{growth}} + \underbrace{100(e - r_t)}_{\text{left}} = -100\,r_d.\]
Everything cancels except \(-100\,r_d\), the dashboard’s 12.0. So the ledger adds up by construction: the last piece is defined as what is left. “It adds up to 12” proves nothing on its own. The evidence is that an independent measurement lands in the same place. The price test found −2.1% orders per user. On a week the recipe expected at \(1 + e\) = 96.9% of the week before, that is \(-100 \cdot \text{lift} \cdot (1+e)\) = 2.1 points. On its own, the leftover is weak: against the summer’s ordinary weekly misses (Chapter 18), it has a range of −0.7 to 4.5.
Break-even for the price. Per user, let revenue change by a fraction \(r\) and drinks by \(d\) (here \(d < 0\)). With a variable cost \(c\) per drink and revenue \(R/D\) per drink, profit changes by \(R\,r - c\,D\,d\). That is positive when
\[\frac{c}{R/D} > \frac{r}{d}.\]
Here \(r\) = −0.0062 and \(d\) = −0.0524, so \(r/d\) ≈ 0.119. With \(R/D\) = $7.36 (group A’s revenue per drink), the threshold is about $0.88 a drink.
Sizing the Riverside test. For a 50/50 test on \(n\) users with per-user mean \(\bar y\) and standard deviation \(s\), the relative standard error is \(s\sqrt{4/n}/\bar y\), times \(\sqrt{1-\rho^2}\) with CUPED (Chapter 22). Power for a true change \(\Delta\) is about \(\Phi(\Delta/\text{SE} - 1.96)\).
Try it: build the bridge
Start with the dashboard’s drop. Take out the pieces one at a time, and watch where the bars land and what the chart lets you say.
A recommendation is a decision
A board decides what to do next. So a recommendation is not a wish (“we should look into prices”) but a decision, written so that someone can say yes or no:
- the decision to be made, and by whom;
- the options, including doing nothing;
- the choice you recommend, labelled as a judgement;
- the cost if you are wrong;
- what would change your mind.
One more question sorts decisions by speed: can it be undone? A price can be changed back next week, though customers who leave may not come back; a new store cannot be unbuilt. Reversible decisions can be made faster, with less evidence, as long as someone is watching.
The price: from “we don’t know” to “we know, unless…”
Since 7 September, prices have been 5% higher for everyone. In the August test, revenue per user stayed about flat: −0.6%, with a range from −2.4% to +1.1%. Customers bought fewer drinks: 3.2% fewer in each order (range 2.5% to 3.8%) and 2.1% fewer orders. Together, that is 5.2% fewer drinks per user (range 3.5% to 7.0%).
Mia’s first draft said “whether this is good depends on the margin”, the profit Steep keeps on each drink. True, and not much help. Flat revenue on fewer drinks means lower costs: every drink not made is tea, milk, a cup and staff time not spent. So she asked a sharper question: how cheap would a drink have to be for the price rise to lose money? Here profit means revenue minus the costs of each drink. Revenue fell by 0.6% of itself; the cost of drinks fell by 5.2% of itself. At the old price, Steep took in $7.36 per drink, delivery fees included. At the test’s best estimates, profit falls only if a drink’s variable cost, what Steep spends to make one more drink, is under about $0.88: 12% of that $7.36. Costs per order, such as delivery, are left out; fewer orders save those too, which only makes the threshold safer.
This is a break-even: the value at which a decision flips. It turns “we don’t know” into “we know, unless…”. Be honest about its edges. At the bad end of the revenue range, the threshold rises to about $3.36 a drink, and the test cannot see customers who order less now and leave later. Mia asked finance for the cost of a drink. Finance is re-pricing after a new supplier contract for tea and milk, and will confirm it on Monday 2 November.
Why test again? The first test ran only two weeks, in summer, and cannot show whether customers who order less will leave later. A second test, old price against new, would measure profit per user, with finance’s cost per drink. Its main metric, the smallest change that matters to finance, and its length in whole weeks are fixed before it starts, and its size is set to see that change (Chapter 19); the August test had only about 64% power for a 2% change in orders. The autumn differs from August only if the range for the difference between the two tests leaves out zero.
Mia’s recommendation, labelled as a judgement: keep the price while the new test runs. If wrong, it costs about 2% of orders, about 1,000 a week at October’s level. What would change it: a cost per drink under about $0.88, or signs that customers are leaving.
Riverside: and if it works, then what?
Riverside’s council passed a rule about courier costs. To cover it, Steep added $0.99 to every consumer delivery fee in Riverside from 5 October (Chapter 23). The fee cost about 4.5% of Riverside’s orders (range 2.6% to 6.4%): about 940 orders in three weeks. Mia’s first idea was a test: drop the fee for a random half of Riverside’s app users for four weeks, and measure what it wins back.
She sized it first (Chapter 19). Riverside is small: 12,301 people opened the app there in the last four weeks of data. A full win-back would mean 4.7% more orders per user in the test half. A plain four-week test would have about 70% power to see that, and about 87% with CUPED. At the low end of the fee’s range, a 2.7% win-back, even CUPED would have only about 41%.
Theo read the plan and asked one question. “And if it works, then what?”
Dropping the fee gives up $0.99 on every order in the group, including the orders that would have come anyway. So each order won back costs $0.99 ÷ 0.0452 = $21.92 in fees. An average Riverside order brings in $13.58 of revenue, $9.93 of it for drinks; without the fee, a won-back order brings $12.59. That is revenue, not profit. No result inside the fee’s own range could make dropping it pay: even at the top of the range, the fees per order won back ($15.47) are more than an order’s whole revenue.
Before you size a test, ask whether any result could change the decision. Mia’s recommendation: keep the fee, run no test, and watch every month how often Riverside’s customers come back. What would change it: a competitor in Riverside without the fee, or lost orders turning into lost customers.
Controls
In place: the nightly reconciliation of orders against app events (Chapter 15; owner: data engineering), and a written plan before every test (since October). Agreed, due 30 November: written experiment rules (Chapters 20–22), and one rule aimed at the root cause of the price story, no price change for everyone without a finished test and finance’s sign-off (owner: Head of Product, with Finance).
Blameless writing
On Wednesday afternoon, Priya came to Mia’s desk with two cups of tea. She put one down and kept holding the other.
“Can I ask how the memo describes the price test?” she said quietly. “My day-3 look.”
Mia turned the screen toward her. The sentence said: The price test was read on day 3, before its planned end on day 14. Steep had no rule about when a test may be read.
Priya read it twice. “You didn’t write my name.”
“The board can’t decide anything with your name,” Mia said. “They can decide something with the rule.”
This is called blameless writing. Hospitals and airlines began this habit, because there a hidden mistake can kill. Teams that run large computer systems made it common in software: after an outage, a time when a service stops working, they review the causes in the process without accusing any person (see Further reading). Blame teaches people to hide problems, and hidden problems come back. It is also usually the less accurate story: anyone at Steep, given the same screen on day 3 and no rule, could have done the same. The fix that protects the next test is the rule.
Every number has an address
A board member who doubts a number should find where it came from in a minute. So every number in the memo has an address: the chapter, and the function or query that made it. This is traceability; Chapter 15 called it lineage, and auditors know it as the cross-reference from a report to its working papers, the files that hold the evidence. The addresses go in an appendix after the page. The page stays one page, and nothing is hidden.
The sceptic’s read
On Wednesday evening, Mia asked Theo to read the page as the most difficult stakeholder: anyone who must act on a decision or will feel its effects. He took a napkin. “What will they ask?” He wrote five questions:
- So orders did not fall 12%?
- How do you know the bug is fixed?
- How sure are you about the price?
- The app update and the price rise both came on 7 September. How do you tell them apart?
- Whose mistake was it?
For the fourth, the “How sure” lines do the work: the bug was counted order by order, and the price was measured in August, before the app changed, with a coin.
The second needed a number. Mia’s first thought was the nightly test: it had passed every night since 4 October. “Look at why it passes,” said Theo. The test checks only groups with 50 or more orders a day. On 3 October, iPhones still on 3.2.0 placed 65 Apple Pay orders, none with an event; on 4 October, 49: below the floor, so the test passed. The overall check passed too, because only 0.97% of that day’s orders lacked an event, under its 1% line. Small broken groups can slip past both checks, and these phones kept losing events until 18 October. A passing test is not proof of a fix. So the memo uses the plain number: since 7 October, about 0.4% of iOS orders lack an event, mostly the normal background loss. Theo added a rule for small groups to his list for this week.
Then he asked a stranger question. “Imagine it is Friday at six, and the meeting went badly. Why?” This is a pre-mortem: before a plan runs, imagine that it has failed and list the reasons (Gary Klein, see Further reading). Mia wrote three. They asked about profit, and we had no number: the memo now gives the break-even. They heard “the price rise was a mistake”: the memo says it may still be right. They heard a name: it has none.
Thursday: the memo
On Thursday 29 October, at 4 pm, Mia sent Dana the page and its appendix. Dana would send it to the board as her own memo, with Mia’s name as the person who prepared it. Here is the page.
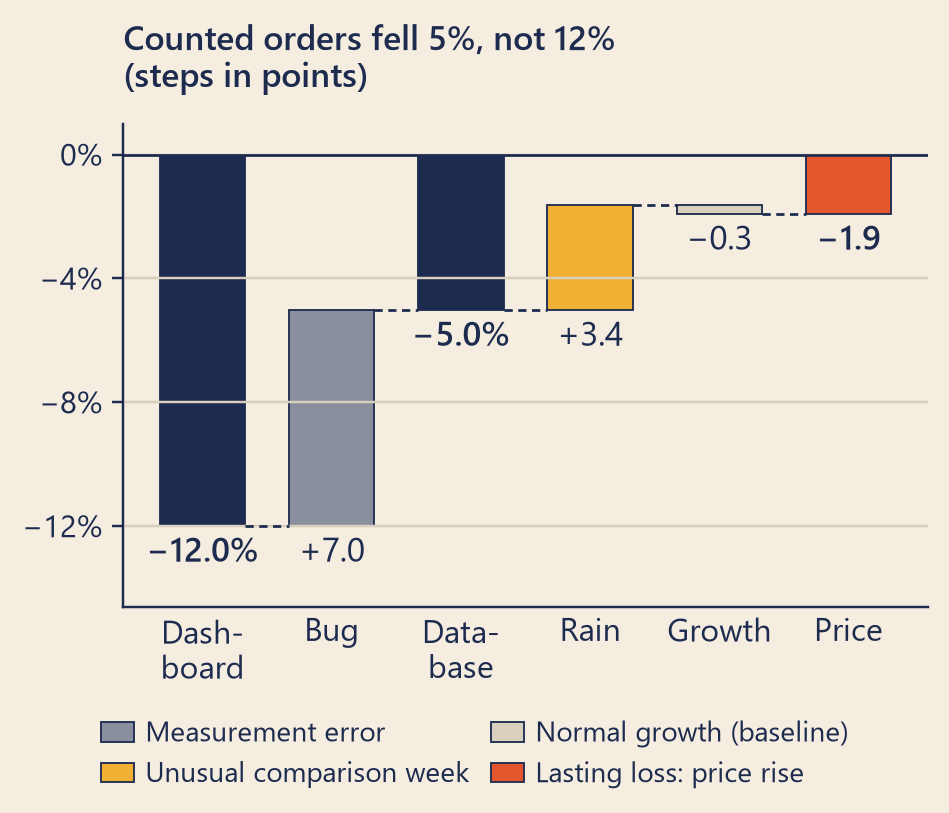
Orders fell 5%, not 12%, and most of that was a rainy comparison week. The only lasting loss, about 2% of orders, came from our price rise. We recommend keeping the price while a longer test measures its effect on profit.
What happened. The dashboard showed orders down 12.0% in the week of 7 September. Counted in the orders database, they fell 5.0%.
How sure. Ranges are 95% intervals; they cover chance, not a wrong model.
- Measured wrongly, 7.0 points. No range needed: a count. 3,361 iPhone orders were paid for, but the app sent no event.
- An unusual comparison week, 3.4 points, less 0.3 for normal growth. Estimated: the week before was rainy (rain brings more orders). Range 3.1 to 3.7.
- Our price rise, about 2 points. Left over: 1.9. The August test, measured separately, says 2.1 (0.5 to 3.7). They agree.
Where orders are now. October has run at about 45,800 completed orders a week, 6% above the week of the drop. The bug is fixed in iOS 3.2.1: since 7 October, about 0.4% of iOS orders lack an event, mostly the normal background loss, plus a few phones not yet updated (none since 18 October).
Decision 1 · Keep the 5% price rise?
- Facts. In August’s test, revenue per user stayed about flat (−0.6%; range −2.4% to +1.1%). Drinks per user fell 5.2% (range 3.5% to 7.0%), so costs fell too.
- Options. Roll back; keep; keep and test again.
- Recommendation (a judgement, not a result). Keep it while a longer test measures profit per user.
- If wrong. About 2% of orders, about 1,000 a week. We can change the price back any day, but customers who leave may not return.
- What would change it. A drink costing us under about $0.88 at the test’s best estimate, or under about $3.36 at the bad end of its range (finance confirms our cost on 2 November). Or signs that customers are leaving.
Decision 2 · Keep the Riverside fee? To cover the city’s new courier rule, we added $0.99 to each Riverside delivery from 5 October. It cost about 4.5% of Riverside’s orders (range 2.6% to 6.4%).
- Options. Keep the fee; drop it for everyone; test dropping it.
- Recommendation. Keep the fee, and do not test dropping it. Each order won back would cost about $22 in fees; an order brings in $13.58.
- If wrong. About 310 Riverside orders a week.
- What would change it. A competitor in Riverside without the fee, or fewer Riverside customers coming back.
Controls. In place: a nightly check of orders against app events (owner: data engineering), and a written plan before every test. Due 30 November: written test rules, and no price change without a finished test and finance’s sign-off (owner: Head of Product, with Finance).
Good news. The one-page checkout raised the share of users who order by 1.6% (relative; range 0.5% to 2.6%). For four weeks, 5% of users keep the old checkout, as an alarm if something goes badly wrong.
Still open. Our cost per drink (Monday). Whether customers who now order less will leave later. A clearly different result from August’s would change our view.
Appendix: every number, with its source (next page).
| Piece | Points | Evidence | Range or check |
|---|---|---|---|
Tracking bug: iOS 3.2.0 with Apple Pay sent no order_completed event |
7.0 | Counted | No range: 3,361 orders, none with an event |
| The week before was unusually rainy | 3.4 | Estimated | 3.1 to 3.7 |
| Normal weekly growth (the real shortfall is larger) | −0.3 | Estimated | −0.4 to −0.1; covers chance, not a recipe that leaves out a cause |
| Left over: the price rise | 1.9 | Tested in August | The test says 2.1 (0.5 to 3.7) |
| Total | 12.0 |
| Number | Value | Chapter | Made by |
|---|---|---|---|
| Dashboard change | −12.0% | Prologue, 1 | m.week_over_week(m.daily_reported_orders(con)) on ads_ceo_dashboard_day |
| Database change (final statuses) | −5.0% | 1, 15 | m.week_over_week(m.daily_true_orders(con)): completed orders |
| … range from customer luck | −6.3% to −3.7% | 17 | bootstrap of customers, 2,000 resamples |
| Orders with no event, bug segment, W2 | 3,361 | 15 | m.missing_completed_by_segment(con, W2) |
| Rain; growth | 3.4 (3.1 to 3.7); 0.3 (0.1 to 0.4) | 16, 17 | m.weather_attribution(con); bootstrap of days and weeks |
| Left over; against summer weeks | 1.9 (−0.7 to 4.5) | 18, 21 | the recipe’s prediction minus completed orders |
| Price test: orders per user | −2.1% (−3.8% to −0.5%) | 21 | m.experiment_users(con, 'price_up_5'), delta-method interval |
| … in points of the 12 | 2.1 (0.5 to 3.7) | 21 | lift × the recipe’s expected W2/W1 |
| Price test: revenue per user | −0.6% (−2.4% to +1.1%) | 21 | same users, net_revenue |
| Price test: drinks per order | −3.2% (−3.8% to −2.5%) | 21, 24 | drinks ÷ orders, users as units |
| Price test: drinks per user | −5.2% (−7.0% to −3.5%) | 24 | items per user |
| Break-even cost share (bad end of revenue) | 11.9% (45.6%) | 24 | revenue change ÷ drinks change |
| Price test: power for a 2% change | 64% | 19, 21 | group A’s noise and group sizes |
| October, completed orders a week | 45,790 | 24 | weeks of 5 Oct, 12 Oct, 19 Oct |
| … compared with the week of the drop | +6.1% | 24 | against 43,153 in W2 |
| Orders lost to the price, a week | 1,001 | 24 | October’s orders ÷ (1 + orders lift) |
| iOS orders with no event, peak | 37.0% on 23 Sep | 15 | counts.reconcile(con, ...) by day and platform |
| iOS below 1% from | 7 Oct | 15 | the same reconciliation |
| Riverside fee effect | −4.5% (−6.4% to −2.6%) | 23 | steep.causal.did(con): city, day, rain |
| … orders lost in three weeks | 943 (532 to 1,362) | 23 | Riverside’s orders ÷ (1 + effect) |
| Riverside: fees per order won back | $21.92 (best case $15.47) | 24 | fee ÷ share of orders lost |
| Riverside: revenue (drinks) per order | $13.58 ($9.93) | 24 | consumer orders, 5–25 Oct |
| checkout_v2 conversion | +1.6% (+0.5% to +2.6%), p = 0.004 | 20 | m.compare_proportions(cv, 'converted') |
| … orders per buyer, A and B | 1.94 and 2.00 | 24 | why it is not turned into orders a week |
| Revenue per drink at the old price | $7.36 | 21, 24 | group A’s net_revenue ÷ drinks, delivery fees included |
| Break-even cost per drink (bad end) | $0.88 ($3.36) | 24 | break-even share × revenue per drink |
| iOS orders with no event since iOS got back under 1% | 0.4%; 71 of them from 3.2.0 | 15, 24 | the same reconciliation |
| Riverside orders lost a week | 314 | 23, 24 | orders lost in three weeks ÷ 3 |
All numbers use the data up to 25 October. m is steep.metrics; every function named here is in the book’s steep/ package.
One number is missing from the page on purpose: the checkout’s gain in orders a week. With the new checkout, buyers also ordered more often (2.00 orders each, against 1.94), so turning the conversion lift into orders would mix two effects; the memo reports the metric the test was planned on.
Dana answered at 4:11: Read it twice. Three minutes. Sending it tonight.
Common traps
- The journey memo, or a buried answer. Start with what you found, not with what you did first.
- Digits nobody needs, or a range without its meaning. Round to what the reader can use; say what a range covers and what it does not.
- “It depends” without a break-even. Find the value at which the decision flips, and say which side you are on.
- Sizing a test before asking what it could change. If no result would change the decision, do not run it.
- Calling a passing test proof. Ask why it passes.
- Blaming a person, or numbers nobody can trace. Both hide what needs fixing.
TipAudit Instinct · A finding, element by element
Internal auditors build each finding from the same elements, usually in this order. The IIA’s Global Internal Audit Standards (2024) name them: compare the criteria with the condition (Standard 14.2); find the root cause and the effect, and rate how serious the finding is (14.3); agree actions that address the root cause (14.4); and in the final report, say who will act and by when (15.1). Here is the price story as a finding.
- Criteria (what should be). Steep had no written policy, so Mia used accepted practice (Chapters 19–22): a test is read at its planned end, on one main metric chosen before it starts, unless it uses a method built for early looks; a price change for every customer needs a finished test and finance’s view of profit.
- Condition (what is).
price_up_5ran 14 days, 10 August to 23 August. It was read once, on day 3, when revenue per user looked up 4.8% (p = 0.002). The full results were ready on 24 August, 2 weeks before the launch on 7 September, and nobody read them. At the planned end, revenue per user was −0.6% (range −2.4% to +1.1%) and orders per user −2.1% (range −3.8% to −0.5%). - Root cause. No written rule for when a test may be read, and no approval step for price changes.
- Effect. About 2% fewer orders, about 1,000 a week, with no measured gain in revenue; the effect on profit is not yet confirmed. The same gap could launch any change on an early reading.
- Rating. High: it touches every customer.
- Agreed action. Written experiment rules, and no price change without a finished test and finance’s sign-off. Owner: Head of Product, with Finance. Due: 30 November 2026.
- Already in place. The nightly reconciliation (owner: data engineering), and, since October, a written plan before every test (Chapters 20–22).
Whether to keep the price stays with management. The finding names a gap, not a culprit, but it does name an owner and a date: blameless is about causes, not about who fixes them.
NoteInterview Corner
1. How would you present an analysis to a CEO?
NoteA model answer
I start from the decision they must make and how long they have. The answer and my recommendation come first. Then two or three points, each tagged as counted, estimated with a range, or my judgement, with the effect in money or customers; then the options, the cost if I am wrong, and what would change my mind. One chart, titled with the finding. I send it a day ahead and talk first to the people whose work is in it. An appendix ties every number to its query.
2. How do you explain uncertainty to a non-technical audience?
NoteA model answer
First, what it means for the decision: “even at the bad end of the range, revenue per user fell by at most 2.4%, and we can change the price back any day.” Then the range in plain words, with what it covers and what it does not, rounded to what it supports. No “likely” without a number. Chances as counts: “about one range in twenty misses”. If the range is too wide to decide, I say what data would narrow it, how long that would take, and what it would cost.
3. Your analysis contradicts what a senior leader believes. What do you do?
NoteA model answer
First I learn why they believe it: they may know something the data does not. I check my own work with a sceptic, then meet them before any wider meeting, show the evidence, and ask what would convince them. If it is their decision, I accept it and record the evidence and the decision. If it is a material risk, such as a wrong number going to the board, I raise it through the proper channel.
Reported change: −12.0% orders, the week of 7 September compared with the week before (CEO dashboard).
Explained so far: 12.0 of the 12 points, closed (Chapter 21): the tracking bug 7.0, the rainy week before 3.4, normal growth −0.3, and the price rise 1.9. Outside the twelve percent: the Riverside fee cost about 4.5% of Riverside’s orders (Chapter 23).
Suspects: —
Ruled out: a new competitor in Northgate (Chapter 5); customers leaving (Chapter 6); the matcha menu (Chapter 4); every stop on the data’s journey after the app (Chapters 8–14); the day-3 “win” for revenue per user (peeking, Chapter 21).
Open questions: none about the twelve percent. For the board: the price and the Riverside fee (Epilogue).
New evidence: the one-page memo, sent to Dana on Thursday 29 October, with an appendix that traces every number.
Recap
- Answer first: the finding and the recommendation, then how sure you are, then the decision. The journey goes in the appendix.
- Keep apart what you counted, what you estimated (with a range and its meaning), and what you recommend (a judgement, with options, the cost if wrong, and what would change it). A break-even turns “it depends” into “we know, unless…”.
- Before you size a test, ask whether any result could change the decision. Use one chart, write about processes, and give every number an address.
| English | 中文 |
|---|---|
| executive summary | 执行摘要 |
| answer first / bottom line up front (BLUF) | 结论先行 |
| pyramid principle | 金字塔原理 |
| journey memo | 流水账式报告 |
| headline | 标题句 |
| judgement | 判断 |
| uncertainty | 不确定性 |
| range | 区间 |
| bridge chart / waterfall chart | 桥图 / 瀑布图 |
| recommendation | 建议 |
| margin | 毛利(每杯利润) |
| variable cost | 变动成本 |
| break-even | 盈亏平衡点 |
| reversible decision | 可逆决策 |
| stakeholder | 利益相关方 |
| blameless review | 无责复盘 |
| outage | 故障 / 宕机 |
| traceability | 可追溯性 |
| working papers | 审计工作底稿 |
| appendix | 附录 |
| pre-mortem | 事前验尸 |
| criteria, condition, root cause, effect | 标准、现状、根本原因、影响(审计发现要素) |
Further reading
- Minto, B. (1996). The Minto Pyramid Principle: Logic in Writing, Thinking and Problem Solving. Minto Books International. Publisher. The source of “answer first, then the reasons, grouped under it”; the publisher notes translations into Chinese and other languages.
- van der Bles, A. M., van der Linden, S., Freeman, A. L. J., Mitchell, J., Galvao, A. B., Zaval, L., & Spiegelhalter, D. J. (2019). Communicating uncertainty about facts, numbers and science. Royal Society Open Science, 6(5), 181870. DOI. A careful review of how to say how sure you are, and what happens when you do.
- Spiegelhalter, D. (2020). The Art of Statistics: Learning from Data (paperback; first published 2019). Pelican. Publisher. A plain-language tour of learning from data, by a statistician who writes for the public.
- Kent, S. Words of Estimative Probability. Studies in Intelligence, 8(4). Central Intelligence Agency, Center for the Study of Intelligence. CIA. The essay behind the “serious possibility” story: what words like “probable” mean to different readers.
- The Institute of Internal Auditors (2024). Global Internal Audit Standards. IIA. Standards 14.2–14.4 and 15.1 describe how a finding is built and reported.
- Klein, G. (2007). Performing a Project Premortem. Harvard Business Review, September 2007. HBR. The pre-mortem in two pages.
- Knaflic, C. N. (2015). Storytelling with Data: A Data Visualization Guide for Business Professionals. Wiley. DOI. How to choose one chart and make its point easy to see.
- Lunney, J., & Lueder, S. (2016). Postmortem Culture: Learning from Failure. In B. Beyer, C. Jones, J. Petoff, & N. R. Murphy (Eds.), Site Reliability Engineering. O’Reilly Media. Free online. How a large engineering team writes reviews that look for causes, not culprits.