On Thursday, Mia came in before eight. On one page of her notebook she had written a plan of three lines.
1. Put a number on Clue 1.2. Check that the fix worked.3. Make sure this cannot happen quietly again.
For more than two weeks, she had collected evidence. On her first day, the dashboard and the orders database had disagreed. By the end of that week, she had seen the last step of the iOS funnel collapse after 7 September, and found that her own receipt, A1024, had no order_completed event in the warehouse. On Tuesday of last week, Theo had shown her that Kafka had not lost it, and she had reported everything to the iOS team. Yesterday, she and Theo had checked that it was not late. On 24 September, the iOS team had released iOS 3.2.1. The release notes said only: “Bug fixes and performance improvements.”
Dana stopped at her desk with a cup of tea. “Theo says you found it. Can I tell the board that most of the twelve percent was a bug?”
“Not yet,” said Mia. “Today I can tell you how many points. And I can tell you how we could have known on the first day.”
Theo looked up from the next desk. “Nobody knew on the first day because nobody was testing. A dashboard is not a test. It only shows you a number. It does not tell you when the number is wrong.”
Mia wrote at the top of a new page: Trust, but verify. It was an old phrase from her audit years. It means: you may trust people, but you still check their work.
ImportantThe big idea
Data quality is a set of controls you test every day, not a feeling.
Look at the picture above. Each teal thread joins a line in one book to the same line in the other book. That is a reconciliation (Chapters 1 and 7): you match two records of the same events, one by one. One line has no partner. Its thread hangs loose, with a red knot at the end. This chapter is about finding that knot every day, automatically.
Six ways data can be wrong
“Data quality” sounds like one thing. It is several. Data management practice usually lists six dimensions of data quality, six different questions you can ask about a table.
Dimension
The question
A Steep example
Completeness
Is everything there?
Every paid order has an order_completed event.
Accuracy
Does it match the real world?
The amount in the database is what the card was charged.
Validity
Does it follow the rules?
payment_method is card, apple_pay or google_pay.
Uniqueness
Is each thing recorded once?
One row per event_id (the copies of Chapter 8).
Timeliness
Is it there in time?
Yesterday’s data is in the warehouse by 07:00 (Theo’s promise, Chapter 13).
Consistency
Do two records of the same thing agree?
The dashboard and the orders database (Chapter 1).
Authors use slightly different lists and names. Researchers who asked data users found many more qualities that matter to them. But these six are the common core, and each one needs its own test. A table can be complete and wrong, or valid and late.
Clue 1 started as a consistency problem: two numbers that disagreed. Underneath, it was a completeness problem: events that should exist and did not.
Putting a number on Clue 1
Every order in the database should have one order_completed event. That gives a simple rule to test. Mia matched every order to its event, as in Chapter 7, and counted the orders with no match. This time she split the count by three columns at once: platform, app version and payment method. One combination of the three, such as “iOS, 3.2.0, Apple Pay”, is a segment.
Table 1: Orders placed in the week of the drop (7–13 September), matched to their order_completed events, by segment.
Platform
Version
Payment
Orders
No event
Missing
ios
3.2.0
apple_pay
3,361
3,361
100.0%
ios
3.1.0
apple_pay
8,138
31
0.4%
ios
3.1.0
card
10,324
26
0.3%
android
3.1.2
card
7,200
25
0.3%
android
3.1.2
google_pay
3,956
18
0.5%
web
web-3.2
card
4,246
8
0.2%
ios
3.2.0
card
4,189
7
0.2%
android
3.2.0
google_pay
1,155
5
0.4%
android
3.2.0
card
2,203
2
0.1%
Read the first row. Apple Pay is the iPhone’s own way to pay: one tap, then a face or fingerprint check, with no card details to type. In the week of the drop, 3,361 orders were paid with Apple Pay on iOS 3.2.0. Not one of them has an order_completed event. Mia checked her own receipt, A1024, placed on 14 September: iPhone, 3.2.0, Apple Pay. Row one.
Now look at two other rows. Apple Pay on the older iOS 3.1.0 lost 0.4% of its events, and card payments on iOS 3.2.0 lost 0.2%. Both are normal. The new version was fine with cards, and Apple Pay was fine on the old version. Only the combination broke.
The count also closes. In the week of the drop, 3,483 orders had no event (Chapter 14 counted them). 3,361 of them sit in this one segment. The other 122 are spread over every other segment: 0.29% of their orders. That is the normal background loss: events lost by ordinary bad luck, such as a phone that crashed or a connection that dropped. In the week before the drop, the background was 0.26%, spread over every segment.
How much of the loss is more than normal? For each segment, Mia took the orders with no event and subtracted the background loss of 0.3% of its orders. What was left is the excess loss. In the week of the drop, 99.5% of all excess loss sat in one segment: iOS 3.2.0 with Apple Pay.
Now the points. Mia put the missing Apple Pay orders back into the dashboard’s daily counts. The dashboard’s fall shrank from −12.0% to −4.8%, the same as all orders in the database. Finance shows −5.0% only because it leaves out cancelled and refunded orders (final statuses, see Chapter 1).
Table 2: From the dashboard to finance’s number, the week of the drop compared with the week before.
What is counted
Change
Points above the dashboard
The CEO dashboard: order_completed events
−12.0%
0.0
The dashboard, with the 3,361 missing Apple Pay orders put back
−4.8%
7.2
All orders in the database, any status
−4.8%
7.2
Finance: completed orders
−5.0%
7.0
So the bug explains 7.0 of the 12 points against finance’s count, or 7.2 against all orders. This book uses 7.0, because finance’s completed orders are the definition of “orders” that Mia wrote into the metric dictionary (Chapter 12). One segment explains the whole gap, almost to the last order.
The iOS team had fixed the symptom fast: they shipped 3.2.1 two days after Mia’s report. This morning, they sent their write-up of the cause. Version 3.2.0 had a new one-tap Apple Pay checkout. On that new path, the app showed the green tick but skipped the code that sends order_completed. Card payments still used the old path, which sent the event. The tea was made and paid for. Only the record of it was missing.
Did the fix work?
A fix is a claim. Mia tested it like any other claim: with the same reconciliation, day by day.
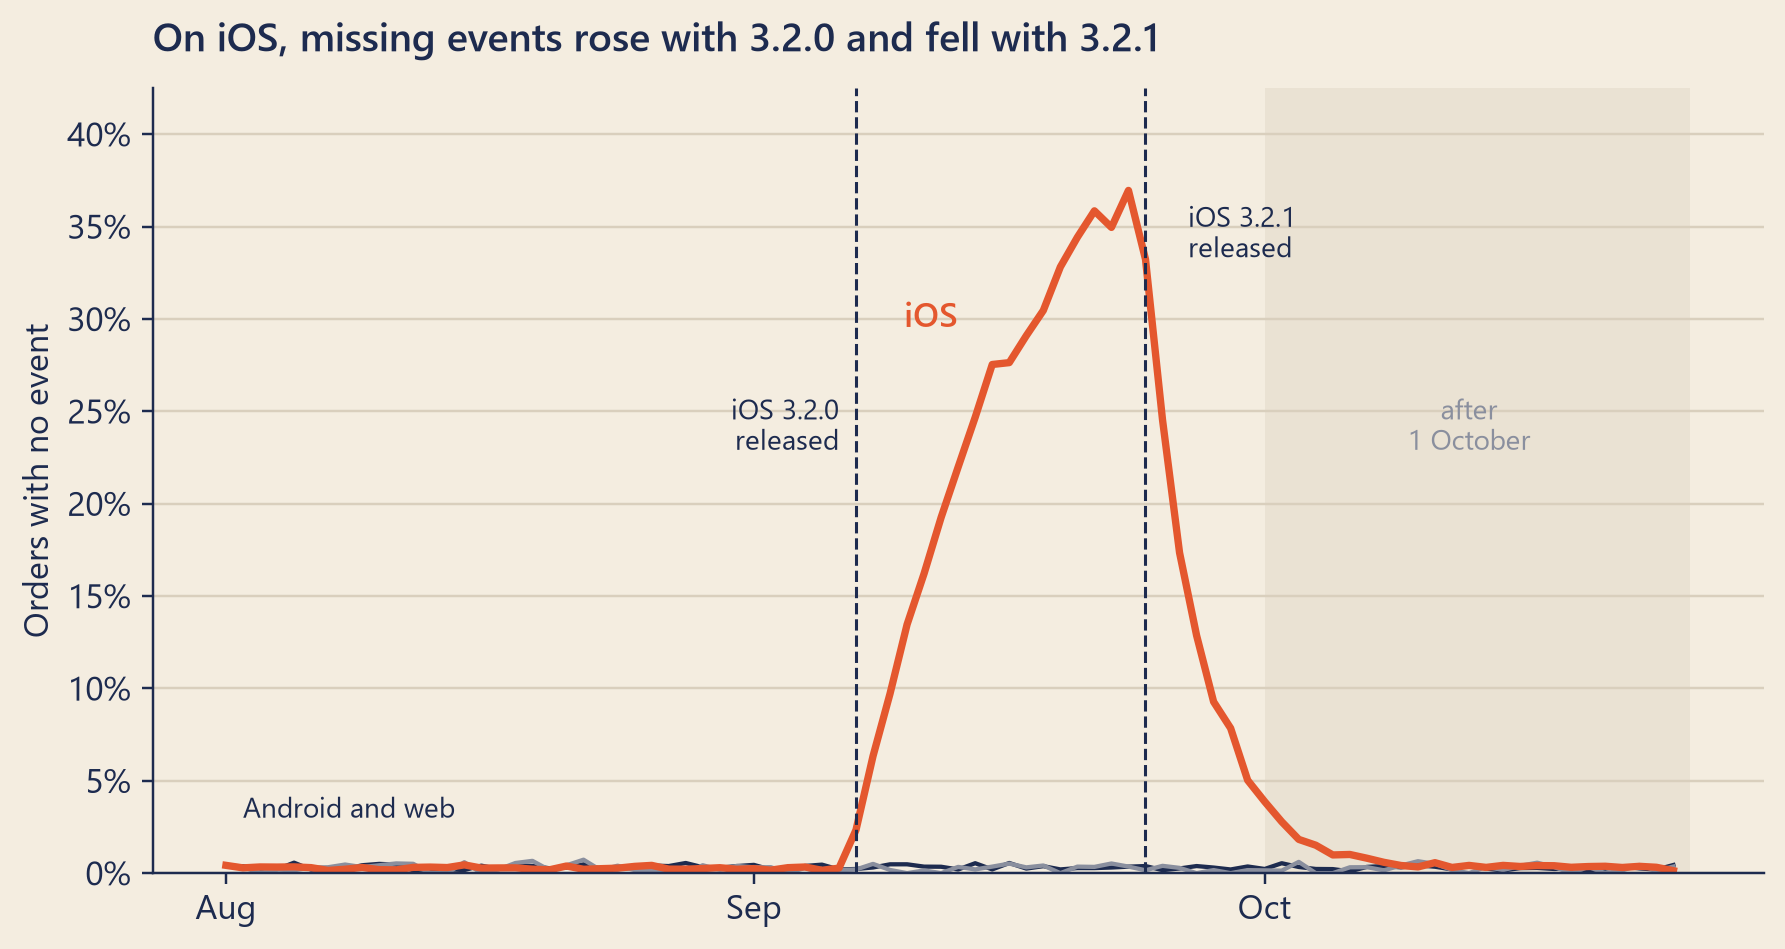
Figure 1: Share of each day’s orders with no order_completed event, by platform. The data in this book runs past 1 October, so the chart also shows what Mia could only predict that day.
Before 7 September, every platform lost about the same small share of events: on average 0.30% of each day’s orders. From 7 September, as more iPhones updated to 3.2.0, the iOS line climbed. It peaked on 23 September at 37.0% of iOS orders. From 24 September, phones updated again, to 3.2.1, and the line fell. Yesterday, 30 September, it was 5.0%.
Did the fix work? Two checks say yes. First, iOS 3.2.1 orders paid with Apple Pay have an event 99.7% of the time, the same as any healthy segment. Second, the gap that is left comes from phones that have not updated yet: yesterday, 4.9% of iOS orders still came from 3.2.0 with Apple Pay.
The data in this book continues to 25 October, so you can look further ahead than Mia could. From 7 October, the iOS line stays below 1%. In the week of 12 October, the share of orders with no event is 0.33% for all platforms together: the normal background again.
A data test is a question asked every day
A data test is a query that looks for rows that break a rule. If it finds none, the test passes. If it finds some, the test fails, and someone is told. You write the rule once, and the computer asks the question every day, after every pipeline run.
Most data tests belong to a few families.
Not null: a column that must always have a value, such as order_id.
Unique: a value that must appear only once, such as event_id after the clean-up.
Accepted values: a column with a fixed list of values, such as status.
Relationships: every order_id in the events must exist in the orders table.
Freshness: the newest row is recent enough, for example less than two hours old.
Volume and anomaly: the number of rows is inside its normal range. An anomaly is a value far from what history leads you to expect.
Reconciliation: two independent sources agree, such as orders and order_completed events.
The first four come built in with dbt, a popular tool that builds warehouse tables from SQL. In dbt, a test is a select that returns the failing rows, which is the same idea as above. Other tools have their own names for the same families.
Each test also needs two decisions. The first is the threshold: how far from perfect is still a pass? Steep loses about 0.3% of events by bad luck, so a test that demands 100% would fail every day. The second is the severity. A warning sends a message and lets the pipeline go on. An error stops the pipeline, so a wrong number never reaches Dana’s wall.
Would a test have caught it?
Mia wrote three tests. Then she did what an auditor does with a new control: she ran it on the past. Running a test on old data, day by day, as if it had always existed, is a back-test.
Test A, completeness: at least 99% of each day’s orders have an event.
Test B, completeness by segment: every segment with at least 50 orders that day has at least 95%.
Test C, volume: the dashboard’s orders are no more than 10% below the same weekday a week earlier.
Show the code
days = pd.date_range(*WINDOW)rows = [("A completeness", test_a), ("B by segment", test_b), ("C volume", test_c)]fig, ax = bk.figure(8, 2.6)ax.grid(False)for r, (name, test) inenumerate(rows): y =len(rows) -1- rfor d in days: ok =bool(test.get(d, True)) ax.add_patch(plt.Rectangle((mdates.date2num(d) -0.42, y -0.36), 0.84, 0.72, color=bk.TEAL if ok else bk.TOMATO, linewidth=0))ax.axvline(mdates.date2num(BUG_DAY) -0.5, color=bk.INK, linestyle="--", linewidth=1.2)ax.text(mdates.date2num(BUG_DAY) -1, 2.62, "iOS 3.2.0", ha="right", fontsize=9, color=bk.INK)ax.set_yticks(range(len(rows)), [name for name, _ inreversed(rows)])ax.set_ylim(-0.6, 2.9)ax.set_xlim(mdates.date2num(days[0]) -0.6, mdates.date2num(days[-1]) +0.6)ax.xaxis.set_major_locator(mdates.WeekdayLocator(byweekday=mdates.MO))ax.xaxis.set_major_formatter(mdates.DateFormatter("%d %b"))ax.tick_params(axis="y", length=0)ax.spines["left"].set_visible(False)ax.set_title(f"The reconciliation tests fail on day one; the volume test fails {c_late_days} days later")plt.show()
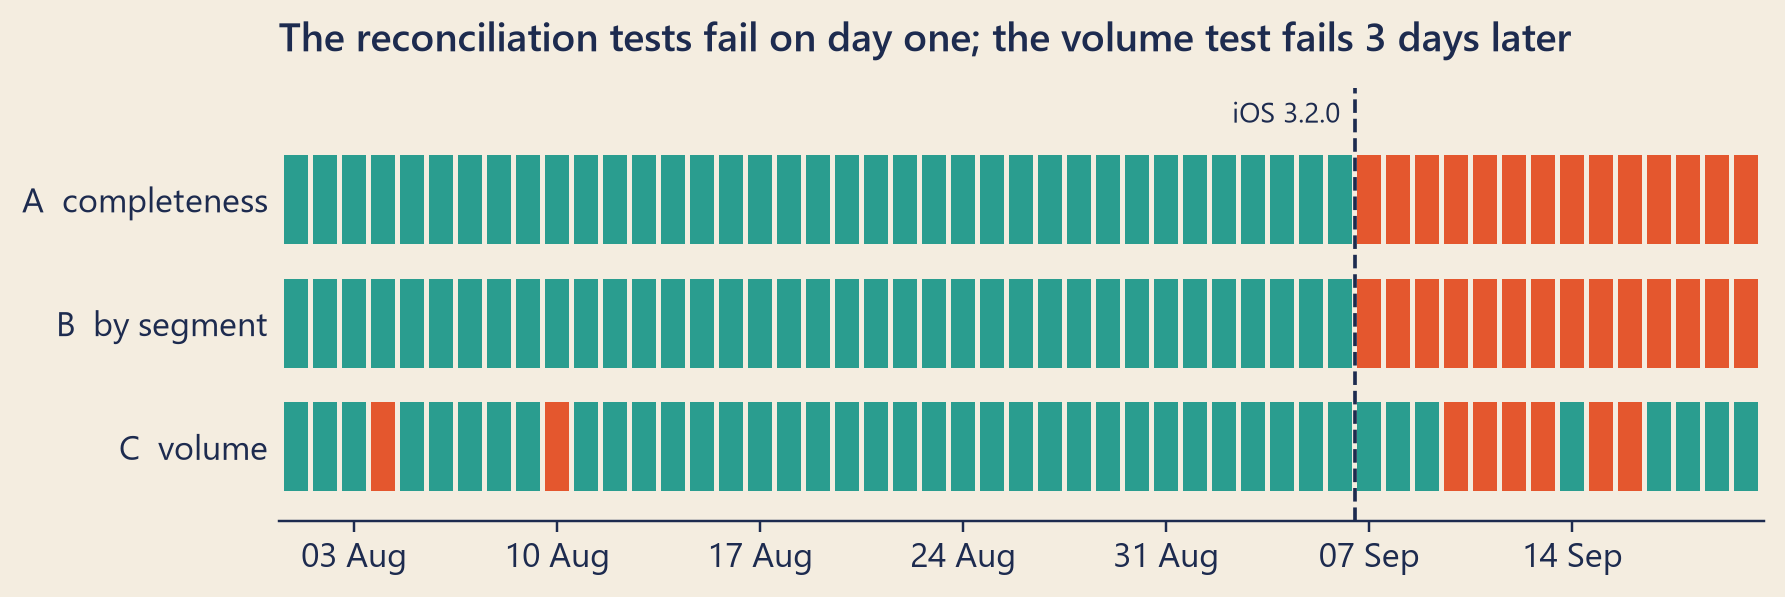
Figure 2: Three data tests run on the past, one square per day. Teal: pass. Tomato: fail.
Test A would have failed on the very first day, Monday 7 September, when 1.46% of orders had no event. In the 98 days before that, it never failed. Test B also failed on 7 September, and it named the segment: iOS 3.2.0 with Apple Pay, 63 orders and not one event. The first of those orders was placed at 07:57 that morning.
Test C, the volume test, did worse in both ways. Since June, it would have raised 5 false alarms, 2 of them in the picture above. Every one came a week after a rainy day, when the comparison week had extra orders. Then it caught the real problem only on 10 September, 3 days late.
Even that alarm was partly luck: it rained in the comparison week, so that week had extra orders. And from 17 September, the test passed every day, while the bug was near its worst, because the same day a week earlier was broken too. A test that compares a number with its own past slowly learns to accept the problem as normal.
The reason is simple. A reconciliation compares two records of the same orders, so its normal noise is tiny. A volume test compares today with last week, and last week is noisy: rain, holidays, a promotion. Volume tests are still useful, for example when a whole pipeline stops. But they cannot see a problem that is small or slow.
If test A had run each night, the alert would have come on the night of 7 September. Theo added that the streaming job from Chapter 14 could do better: match the orders topic with the app’s events as they arrive, per segment, and raise the alarm within the hour. It would need a threshold that allows for events still on their way (Chapter 14). In a normal week, one hour after the order, 0.7% of orders still had no event, close to test A’s line of 1%.
Contracts, lineage and owners
A test finds a problem. Three habits make sure the problem gets fixed, and stays fixed.
A data contract. A data contract is a written agreement between the team that produces data and the teams that use it. For order_completed, the contract with the app teams would say: when the event fires (after a successful payment, on every payment path), which fields it must carry, which values are allowed, and a promise, such as “at least 99% of paid orders send the event within one hour”. It also says who owns the event, and how changes are announced before a release. The iOS team agreed to one more line: before each release, place a test order with every payment method and check that the event arrives. That one check would have stopped 3.2.0.
Lineage.Lineage is the map of which table is built from which (Chapter 12). When test A fails, lineage answers the next question: what else is wrong? The order_completed events feed dwd_event_detail, which feeds the dashboard’s orders and revenue. So both numbers on Dana’s wall were too low, and both needed a note for the board.
Ownership. Every test needs an owner: a person who receives the alert and must act on it. A test that alerts nobody is not a control. It is decoration.
NoteUnder the hood
Completeness and excess loss. For a segment \(s\) with \(n_s\) orders and \(k_s\) orders with no event, completeness is \(1 - k_s / n_s\). With a background loss rate \(p_0\), the excess loss is
\[e_s = \max(0,\; k_s - p_0\, n_s),\]
and the bug segment’s share of all excess loss is \(e_{\text{bug}} / \sum_s e_s\). This is the same calculation as the book’s test of the case (bug_share_of_excess_loss in steep/metrics.py).
Choosing a threshold from history. If each event is lost by chance with probability \(p_0\), the share lost on a day with \(n\) orders has a standard deviation of about \(\sqrt{p_0 (1 - p_0) / n}\). With \(p_0\) = 0.3% and about 6,456 orders a day, three standard deviations above the background is 0.50%. The highest share in the 98 days before the bug was 0.50%. So test A’s threshold, 1% of orders with no event, sits well above normal noise and below the bug’s first day (1.46%).
Why test B needs a minimum size. In a small segment, one lost event is a big share. For a healthy segment of 50 orders, test B fails only if three or more events are lost. The chance of that, with \(p_0\) = 0.3%, is about 0.05% per segment per day. With 10 orders, one lost event would already fail the test.
Why test C is noisy. Before 7 September, the dashboard’s change against the same weekday a week earlier had a standard deviation of 5.7%. A 10% threshold is only about 1.8 standard deviations away, so false alarms are expected.
Try it
Write a data test. Choose a test and a threshold, pick the days, and see which days pass. The tests run in your browser on two files: recon_daily (orders and orders with an event, per day and segment) and the CEO dashboard. Days with an iOS release have a yellow border.
dqTests =newMap([ ["Completeness: all orders", {kind:"total",min:90,max:100,step:0.1,value:99,rule:"Pass if at least this share of the day's orders have an order_completed event."}], ["Completeness: each platform", {kind:"platform",min:90,max:100,step:0.1,value:99,rule:"Pass if every platform (ios, android, web) reaches this share."}], ["Completeness: each segment", {kind:"segment",min:50,max:100,step:0.5,value:95,rule:"Pass if every segment (platform × version × payment) with at least 50 orders reaches this share."}], ["Volume: dashboard vs a week ago", {kind:"volume",min:1,max:30,step:1,value:10,rule:"Pass if the dashboard's orders fell by less than this percent against the same weekday a week earlier."}]])
dqSql = {if (!dqFrom ||!dqTo) returnnull;const iso = d => d.toISOString().slice(0,10);const range =`BETWEEN DATE '${iso(dqFrom)}' AND DATE '${iso(dqTo)}'`;const t = dqThreshold /100;const n = dqFacts.segmentMinOrders;if (dqTest.kind==="total") return`-- Completeness of all orders, day by daySELECT strftime(order_date, '%Y-%m-%d') AS day, sum(orders_with_event)::DOUBLE / sum(orders) AS value, NULL AS worst, sum(orders_with_event)::DOUBLE / sum(orders) >= ${t} AS passedFROM reconWHERE order_date ${range}GROUP BY order_dateORDER BY order_date;`;if (dqTest.kind==="platform") return`-- Completeness of each platform; the day fails if any platform failsWITH by_platform AS ( SELECT order_date, platform, sum(orders_with_event)::DOUBLE / sum(orders) AS completeness FROM recon WHERE order_date ${range} GROUP BY order_date, platform)SELECT strftime(order_date, '%Y-%m-%d') AS day, min(completeness) AS value, arg_min(platform, completeness) AS worst, min(completeness) >= ${t} AS passedFROM by_platformGROUP BY order_dateORDER BY order_date;`;if (dqTest.kind==="segment") return`-- Completeness of each segment with at least ${n} ordersWITH segments AS ( SELECT order_date, platform || ' ' || app_version || ' ' || payment_method AS segment, orders_with_event::DOUBLE / orders AS completeness FROM recon WHERE order_date ${range} AND orders >= ${n})SELECT strftime(order_date, '%Y-%m-%d') AS day, min(completeness) AS value, arg_min(segment, completeness) AS worst, min(completeness) >= ${t} AS passedFROM segmentsGROUP BY order_dateORDER BY order_date;`;return`-- Dashboard orders against the same weekday a week earlierWITH daily AS ( SELECT event_date, orders, lag(orders, 7) OVER (ORDER BY event_date) AS week_ago FROM dashboard)SELECT strftime(event_date, '%Y-%m-%d') AS day, orders::DOUBLE / week_ago - 1 AS value, NULL AS worst, orders::DOUBLE / week_ago - 1 >= -${t} AS passedFROM dailyWHERE event_date ${range} AND week_ago IS NOT NULLORDER BY event_date;`;}
Show the code
dqResult = {if (!dqSql) return {rows: [],error:"Pick a start and an end date."};try {const rows =await dqDb.query(dqSql);return {rows:Array.from(rows, r => (typeof r.toJSON==="function"? r.toJSON() : r)),error:null}; } catch (e) {return {rows: [],error:String(e && e.message? e.message: e)}; }}
Run “Completeness: all orders” from 24 August. Which day fails first? Now lower the threshold to 98%. How many days late is the alarm now?
Switch to “Completeness: each segment”. The table names the segment that failed.
Switch to “Volume”, start on 1 June, and look for the tomato days before September. Those are false alarms. Then raise the threshold until they disappear, and see what happens to September.
Pick 1 October to 25 October. When does each test pass again?
Common traps
Testing only the total. On 7 September, only 1.5% of all orders had no event. The broken segment had lost every single event. Test at the level where problems live.
Thresholds without history. A threshold that is too tight fails every day, and people learn to ignore it. A threshold that is too loose never fails. Set it from the normal noise in the past.
Comparing things that are not the same. The dashboard counts events for every order, cancelled ones included. Compare it with all orders, not with completed orders, or a healthy day will look broken.
A test with no owner. An alert that nobody reads is the same as no test.
Testing a number against itself. A volume test compares the dashboard with its own past. A reconciliation compares it with an independent record. Prefer the independent record.
Assuming a fix worked. Measure it with the same test that found the problem.
TipAudit Instinct · Testing a control
Auditors test a control in two steps. Design effectiveness asks: if this control runs as written, would it catch the problem? Operating effectiveness asks: did it really run, every day of the period, and did someone act when it failed?
A data test is an automated control. Once it is built and protected from casual change, it runs the same way every time. So auditors test automated controls differently from manual controls, which depend on a person on a good day. For an automated control, they check the logic once, and then check that nobody changed it. Only the query is automated, though. Reading the alert and acting on it is a manual step, so auditors test that part every period, for example by sampling alerts and checking what was done.
Mia’s back-test is a design test: on the past data, test A would have failed on day one. Operating effectiveness starts tonight: the test must run, and its alerts must reach an owner.
And the oldest control of all is a reconciliation. Every month, an accountant matches the company’s cash book with the bank statement, line by line. Each line on one side needs a partner on the other. Mia did the same with orders and events. Look at the opener picture again: the loose thread is the line with no partner.
NoteInterview Corner
Q1. How do you monitor data quality in a pipeline?
NoteA short answer
With tests after each step, grouped by dimension: not null, unique and accepted values on keys and codes; relationships between tables; freshness for timeliness; volume and anomaly checks against history; and reconciliations against an independent source, at the grain where problems appear (for example per platform and app version). Each test has a threshold from historical noise, a severity (warn, or stop the pipeline), and an owner who gets the alert. Back-test new tests on past data before you trust them.
Q2. A metric dropped 12% overnight. What are your first five checks?
NoteA short answer
The definition: did the metric’s query, filters or source change? 2. Completeness: did all the data arrive (row counts, freshness, late or failed loads)? 3. A second source: does an independent record, such as the orders database, show the same drop? 4. Segments: is the drop everywhere, or in one platform, version, city or payment method? Check what was released or changed on that day. 5. The baseline: was the comparison day unusual (weather, holiday, promotion)? Only then look for a real change in behaviour.
Q3. What is a data contract?
NoteA short answer
A written, versioned agreement between the producers of data (such as an app team) and its consumers. It defines the schema and meaning of each field, when events fire, allowed values, quality promises (for example completeness and freshness targets), the owner, and how changes are announced. Good contracts come with automated tests, so a release that breaks the contract is caught before or right after it ships.
One clue closed
At four o’clock, Mia knocked on Dana’s door. She brought one page.
“Seven points of the twelve were never real,” she said. “On 7 September, iOS 3.2.0 started to drop the order_completed event for every Apple Pay order. The tea was sold and paid for. The dashboard counts events, so it did not see those orders. The iOS team fixed it in 3.2.1, and the missing share is falling as phones update. From tonight, a test checks this every day, for every segment.”
Dana read the page twice. “So you found the seven,” she said. “And the other five?”
“The orders database confirms a fall of about five percent,” said Mia. “That part is measured correctly. But I do not know yet what caused it, or whether the comparison is fair.”
“The rain?” said Dana. “Priya said it was the weather.”
“Maybe. That is my next question: was the week before the drop a normal week to compare with?”
Mia had followed A1024 along the whole road from her phone to Dana’s screen. Now she knew the one stop where its event was lost: the app.
Reported change: −12.0% orders, the week of 7 September compared with the week before (CEO dashboard).
Explained so far: 7.0 of the 12 points: measurement. iOS 3.2.0 with Apple Pay sent no order_completed event, so the dashboard missed 3,361 orders in the week of the drop (99.5% of the excess loss). Put back, the dashboard shows −4.8%, the same as all orders in the database; finance’s −5.0% leaves out cancelled and refunded orders. Fixed by iOS 3.2.1, released on 24 September. Clue 1: closed.
Suspects: the app, iOS 3.2.0 with Apple Pay: proved (this chapter). It is the one stop on the journey of A1024 where the event was lost.
Ruled out: the matcha menu (Chapter 4); Kafka (Chapter 8); storage (Chapter 9); compute (Chapter 10); refunds and restatements (Chapter 11); the warehouse layers (Chapter 12); the pipeline incident (Chapter 13); late data (Chapter 14).
Open questions: About 5.0 points remain: the fall the database confirms. Is the comparison fair, or was the week before the drop unusual? (Chapter 16.) Why did drinks per order fall after 7 September, and what did the price test really show? (Chapter 21.)
New evidence: the segment table; a back-test that fails on 7 September; new controls: a nightly reconciliation of orders and events, per segment, with an owner, and a data contract with the app teams.
Recap
Data quality has several dimensions: completeness, accuracy, validity, uniqueness, timeliness, consistency. Each needs its own test.
A data test is a query for rows that break a rule, run every day, with a threshold from history, a severity and an owner. Reconciliation against an independent source is the strongest test.
Back-test a new test on the past: here, a reconciliation by segment would have failed on 7 September, the first day of the bug. Clue 1 is worth 7.0 points.
English
中文
data quality
数据质量
completeness
完整性
accuracy
准确性
validity
有效性
uniqueness
唯一性
timeliness
及时性
consistency
一致性
reconciliation
对账
background loss
背景丢失(正常丢失率)
data test
数据测试
threshold
阈值
severity
严重级别
anomaly detection
异常检测
back-test
回测
data contract
数据契约
lineage
血缘
owner
负责人
control
控制
design / operating effectiveness
设计有效性 / 执行有效性
Further reading
Richard Y. Wang and Diane M. Strong, “Beyond Accuracy: What Data Quality Means to Data Consumers”, Journal of Management Information Systems 12(4), 1996, pages 5–33. doi:10.1080/07421222.1996.11518099. The classic study that asked data users which qualities matter to them.
Leo L. Pipino, Yang W. Lee and Richard Y. Wang, “Data Quality Assessment”, Communications of the ACM 45(4), 2002, pages 211–218. doi:10.1145/505248.506010. Short and practical: how to turn quality dimensions into measurements.
The dbt documentation, “Add data tests to your DAG”: data tests as queries that return failing rows, and the four built-in generic tests.